


Friday Speedrun: July 14, 2023
Risk parity spoke in class today

Hello. It’s Friday. Thanks for signing up. I’m Brent Donnelly.
The About Page for Friday Speedrun is here.

Here’s what you need to know about markets and macro this week
Global Macro
It was an exciting week in global macro as risk parity had a multi-standard-deviation kinda week, US CPI came in on the very low end, the dollar got creamed and stocks have now recovered 77% of their losses off the 3500 low that printed on the stronger-than-expected CPI print in October 2022. The two major lows in the S&P 500 were (ironically) both touched on strong CPI data as markets were forward-looking and correctly saw better inflation conditions ahead. A tricky aspect of trading is that markets don’t make lows on good news!
SPX with 200-day moving average and two bad CPI prints labeled

The interesting thing here is that one can easily argue that US inflation will bottom around here given the base effects going forward and perhaps if markets are forward-looking we should be concerned that the easy part was getting inflation from 9.0% to 3.5% and the hard part will be to get it from 3.5% to 2.0%. But whatever! For now, those expecting a return to normal inflation in the 2% area are in the driver’s seat and stocks are riding a rocketship to Neptune.
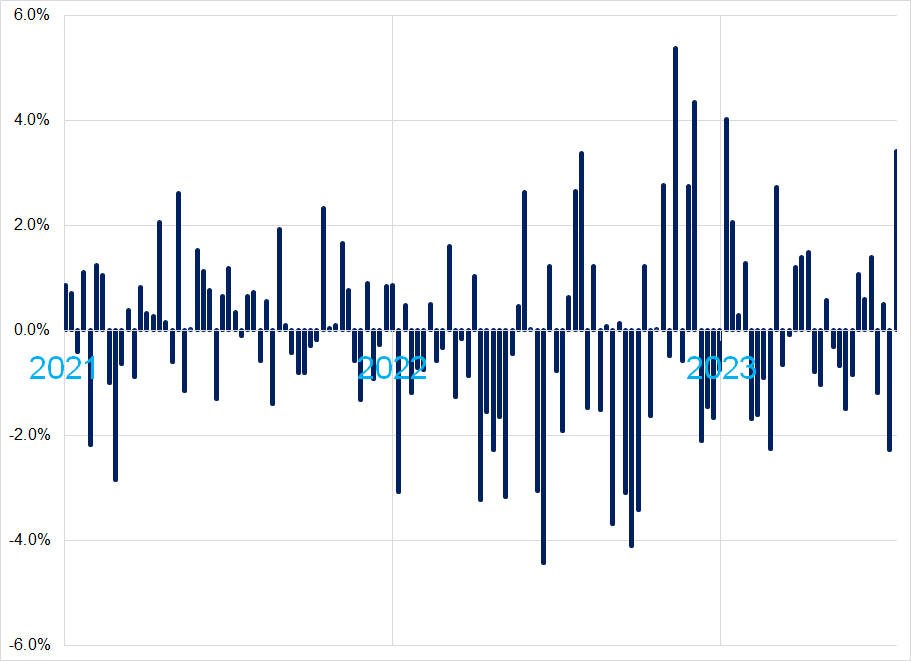
Here is the weekly performance of a basic risk parity strategy over the past few years. You can see that this week was the second-best performance of 2023 and the fourth-best performance of the 133 weeks covered by the chart.
Risk Parity Index, weekly performance 2021 to 2023
What is risk parity?
The standard portfolio approach used in many textbooks is for investors to hold 60% stocks and 40% bonds. The problem with this approach, potentially, is that stocks are much more volatile than bonds and therefore around 90% of the variance in a 60/40 portfolio comes from stocks. To get around this, you lever up the bond side so that the stocks and the bonds have equal influence on your returns.
You can read a full writeup on risk parity here.
While they did not invent risk parity, Bridgewater was the first company to offer it as a product to investors and while the link I posted above on risk parity is boring and fact-heavy, the origin story of The All Weather Portfolio is much more interesting. I strongly suggest you give it a read because it has applications outside of risk parity.
https://www.bridgewater.com/research-and-insights/the-all-weather-story
The idea of creating an all-weather portfolio is a strong conceptual framework for putting together different assets or securities into a bundle that helps you survive and hopefully thrive in various regimes. Stocks are great when times are good but risk parity shields you when times are bad and gives you most of the upside of stocks with less volatility. Sometimes.
The dream regime for risk parity is one where stocks and bonds are both going up at the same time and the period after the Global Financial Crisis was exactly that dream regime. Central banks were buying bonds and keeping rates low while stocks were juiced to infinity by loose monetary until 2013 and insane fiscal policy starting in 2017 poured diesel on the inferno.
This excellent performance by risk parity stopped abruptly in 2022 as global rate hikes and QT crashed the party like a SWAT team. The next chart shows risk parity vs. the S&P 500 in the top panel and the relative performance of the two strategies in the bottom panel, in black.
Risk parity vs. SPX, 1998 to now
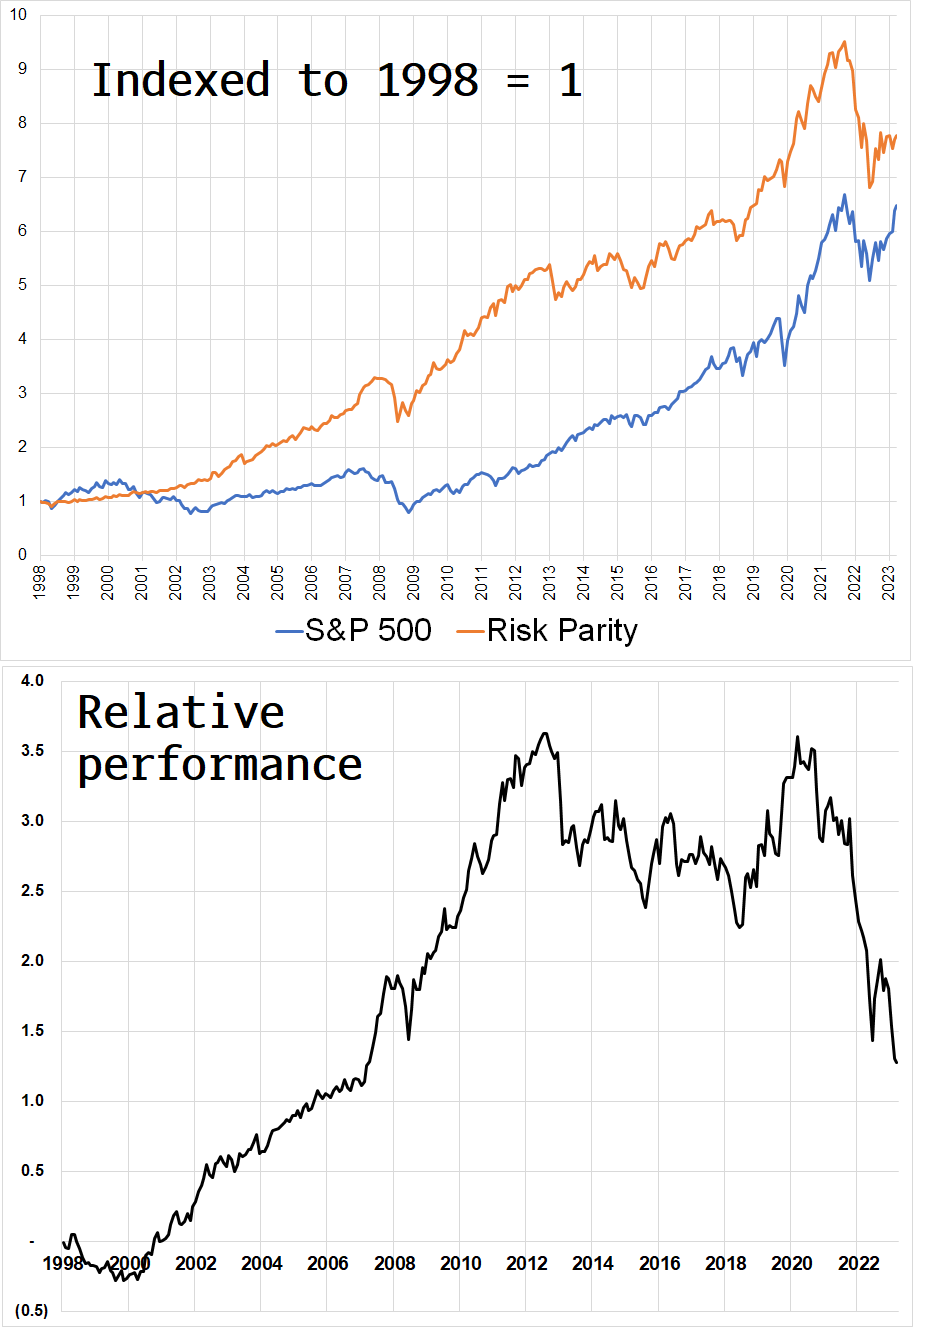
It is nearly unheard of for risk parity to go down two years in a row and 2023 has been pretty good so far.
This week’s CPI number came in at 0.158% vs. economist expectations of 0.3% and while traders were leaning towards a weaker figure, the 0.158% was catnip for equities and they ripped to new 2023 highs.
One might have thought that this would be a reasonable place for equities to put in the highs (a mirror image to the way they put in the lows on strong CPI). Maybe markets will be forward-looking again and see that this is probably the lows for inflation as suggested by this excellent chart from BofA.

Then again, that chart assumes MoM inflation will be positive going forward and some are making the case for negative numbers ahead as goods prices, shipping costs, used car prices, and other indicators are in collapse mode.
Would you like a 1-month trial of my global macro daily, am/FX?
Stocks
The theory is that stocks go up the escalator and down the elevator and that is one reason why equity index puts are generally more expensive than calls. 2008 is a textbook example:
S&P 500 2008 to mid-2010

So even though puts were expensive, they paid off in 2008 (if your timing was good). But this is the NASDAQ during the current cycle:
NASDAQ June 2021 to now

This is almost perfect symmetry of losses and gains in terms of both time and price change. Lots of people lost a lot of money on puts in 2022, even though stocks dropped considerably.
We are now about 95% of the way back to the 2022 NASDAQ highs despite skyrocketing interest rates, an inverted yield curve, contracting consumer credit, and many other scary monsters. It is very, very hard work being bearish stock indexes. You need perfect timing and perfect trade structuring and you will very often be correct and still lose money.
Here is a quick description of how you can make and lose money in the market.

The all-time high in NASDAQ futures is ~16800 and S&P Futures ATH is 4815. Keep an eye on those levels as they are essentially the last hope for the bears. Through there should be another giant-sized capitulation trade as there are probably still humbled bears that will give it one last try, selling into the approach of the ATH. If this is a repeat of the eye-watering rally in 2007, it will take out the ATH, kill the last permabear, and then go Wile E. Coyote style.
Here is this week’s 14-word stock market summary:
Microstrategy and Nvidia are both at 460. Gravity is not a thing in equities.
Sometimes you will see comments or FinTweets like: “Stocks can’t defy gravity forever!” This is wrong. They can. Stocks have long-term positive drift and pay dividends. They trend higher over time. They can go down or sideways for prolonged periods. But there is no gravity. That is the wrong framework. Picture something more like antigravity and you are closer to the truth.
S&P 500, 1871 to now: Il n’y a pas de gravité

Fun fact that mostly only French-speaking people know: If you hold down the ALT button and on the number pad press 1, 3, 0, you get “é”. All the ASCII characters have a unique numeric code like that. I had a summer job typing memos in English and in French in 1993 or so. I know all the good ALT-ASCII codes. All of them. Superscript 1 ….¹ …. is ALT-0185. That one is handy.
Bonds
CPI took bond yields lower, but yields were already falling well before CPI came out.
US 10-year yield, hourly, December 2022 to now

Bonds are in an ongoing tug of war between current strength in the economy, which has been shockingly persistent despite tightening lending and credit contraction, and the dismal future outlook suggested by some forward-looking data and ongoing credit contraction.
Here’s what is priced in for the Fed now:
Fed pricing (number of hikes or cuts on right y-axis)

With the yield curve inverted, the market is almost always going to price cuts in the future, but those cuts just keep getting rolled out further and further. There was a time, not long ago, when rate cuts were priced for the upcoming July 2023 Fed meeting. That was wrong!
Fiat Currencies
The USD had a bit of a moment this week; it got rekt. This was odd at first because US yields were at the highs. The chart of US yields and the chart of the US dollar were basically the same thing for the past two years, but check out the decouplage now.
Dollar Index (black bars) vs. US 10-year yields (blue line)

Part of this is a big positioning unwind in USDJPY as CTAs were max long USDJPY and the price going lower forced a bunch of USD selling as those CTAs use price and trend following as a major input. There was also some movement on the Bank of Japan (BOJ) story as the market is increasingly pricing in a change to the radical YCC policy employed by the BOJ. Check out this round tripper:
USDJPY hourly for 2023

Unlike the NASDAQ, USDJPY stayed true to its “up the escalator, down the elevator” nature as it took a month to rally from 137.40 to 145.00 and just 10 trading days to unwind the move. The fun part is probably over for USDJPY shorts now as we did a perfect little false break of all the big supports and we’re now trading back above them all. Bullish consolidation 138/141 from here, I think.
Meanwhile, EURUSD and GBPUSD have cleanly broken out to the topside with massive 1.1080 resistance in EURUSD and 1.2980/00 resistance in GBPUSD cleanly breached. As long as those pairs are above those key levels, they are in bullish trend mode.
And I doubt you care, but EURSEK did this! It is highly unusual for EURSEK to move 50 handles in one week and I bet some FX trader in Stockholm just had the best or worst week of his life!
EURSEK hourly chart back to June 2023

Crypto
A judge ruled that Ripple is not a security or maybe isn’t always a security and altcoins RIPPED. The US District Court ruled that while Ripple might be a security when institutions buy it, it’s not fair to just blanket declare that it’s always a security.
This is great news, at least in theory, for altcoins because much of the pressure from regulators in the US has been focused on securities law violations and their increasingly-vocal insistence that most cryptocurrencies are securities. The ruling could be subject to appeal etc., but for now XRP is an insta-two-bagger.
Ripple hourly, April 2023 to now

Remember that altcoins like MATIC had dropped from 0.90 or so down to sub 0.50 on the Coinbase lawsuit and ironically that ruling created a nice margin of safety for shitcoins. As I said in the June 16 Friday Speedrun (just after the Coinbase kerfuffle began):
Perversely, one could now make the argument that the risk has finally been recognized and if you are in love with something like MATIC, it’s 40% cheaper and now properly priced. In other words, your margin of safety is now larger in mainstream altcoins because the regulatory risk is appropriately priced in.

I am wrong plenty, and if you know my other writing, you know I will also point out when I am very wrong. In this case, it was a good call. As per the grid that appeared earlier in this piece, I declare myself to be a fking genius. :]
Commodities
A weak USD is almost always (but not always) good for commodities. This week, commodities grudgingly played ball and rallied a bit on the dollar weakness. Oil is doing a nice job of holding the line below $65 and seems to be in a nearly perfect 64/84 range. Here is visual evidence:
NYMEX Crude oil hourly, December 2022 to now

I wrote a few pages on gold in am/FX this week which you may find interesting.
Alright. That was 6 minutes! You’re done.
Get rich or have fun trying.
Links of the week
Interesting / smart
This piece is excellent and only takes three minutes to read. I recommend you forward it to people aged 18-23.

An excellent one-hour macro podcast
https://www.toptradersunplugged.com/podcast/louis-vincent-gave-global-macro-series-july-5th-2023/
Can you name these songs? Answers next week

Music!
Recommendation via 92-mph fastball
Great read Brent. You nailed some great concepts on understanding how markets and psychology work in a fun and easy-to-understand way. I'll be printing this one off and reading it again and again.
Geil! That describes it best.