Hello. It’s Friday. Thanks for signing up. I’m Brent Donnelly.
The About Page for Friday Speedrun is here.
Here’s what you need to know about markets and macro this week
Global Macro
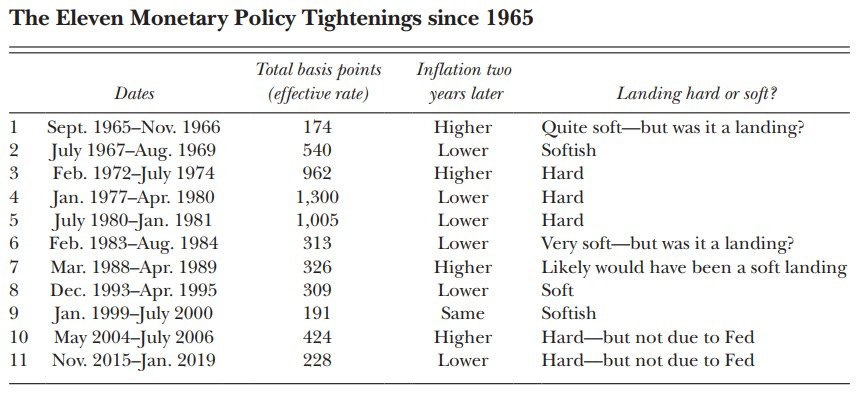
The optimists are in control. There is this “common knowledge” that there’s no such thing as a soft landing, but that’s empirically false. 1995 was a soft landing, as was 1983 and 1966/1967. They’re not the odds on favorite, but they do happen.
The data this week was all in the soft landing category with CPI cooling, jobless claims ticking a bit higher, Retail Sales OK but not booming, and Atlanta Fed GDP around 2.2%.
Meanwhile, the end of the world has not arrived in Germany or Korea, either, as data there has rebounded from decidedly ugly levels.
Germany ZEW (expectations index)
I have been a seller of soft data like sentiment this year, because it’s not been particularly predictive of anything, but the hard data is showing the same thing. Sentiment and exports are rising into positive territory as a mini-rebound in global manufacturing seems to be kicking in.
South Korea Exports (YoY)
Cooling US data and rebounding global data is the sweet spot for risky assets.
At the peak of the US inflation panic, housing, used cars, and gasoline prices dominated the headlines. Now rents and housing look to have peaked, used car prices are back where they were two years ago, and oil and gas prices are unchanged from 2021, too. The two charts show used cars (left) and oil (right) back to early 2021.
Stocks
Hitting the sweet spot for risky assets looks like this:
SPX (cash) hourly back to mid-September
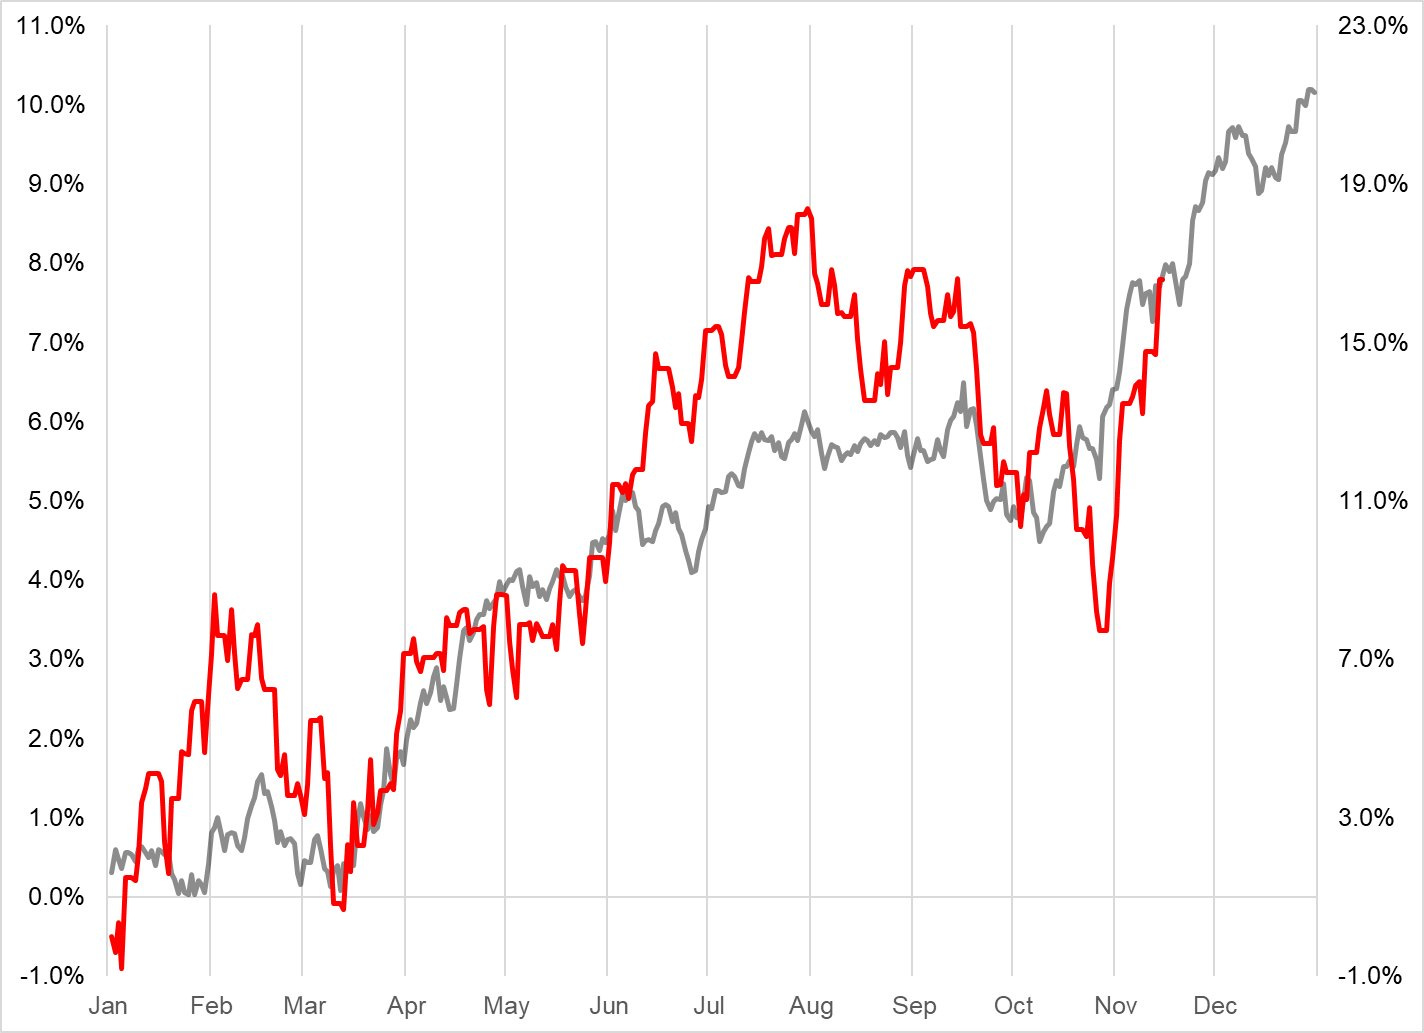
This move is buttressed by strong seasonals as there is always a lack of selling late in the year. This next chart shows the average path of the SPX in the past (1995 to 2022) vs. the path this year. So easy a caveman could do it.
SPX average performance (gray) vs. this year performance (red)
The left y-axis is the gray line and right one is the red line. This is not y-axis manipulation because what matters when analyzing seasonality is direction, not magnitude. That is, seasonals give you a probabilistic view of up or down, but don’t predict the size of the move.
The Spectra Markets Trader Handbook and Almanac gives you all the seasonal signals in real-time, not just for stocks, but for every macro asset class. Last year’s Almanac was a red-hot example of how seasonality works, out of sample. Here are the results for all the signals in last year’s Almanac:
A 60.6% win rate is exceptionally good. You can buy the 2024 Trader Handbook right here. If you trade or invest, you should buy it. You can read more detail about the Almanac here.
Here is this week’s 14-word stock market summary: The optimists are in control. The path of least resistance for stocks is up.
Interest Rates
The Fed and Treasury tag team restored order to the bond market and shows for the zillionth time that when markets are a political utility, you have to listen to policymakers. You can hate the game, but if you want to play it, you’re better off just understanding it and playing it according to how it works in real life, not how you wish it worked in the mythical Land of Free Markets. Trade what is, not what “should be.”
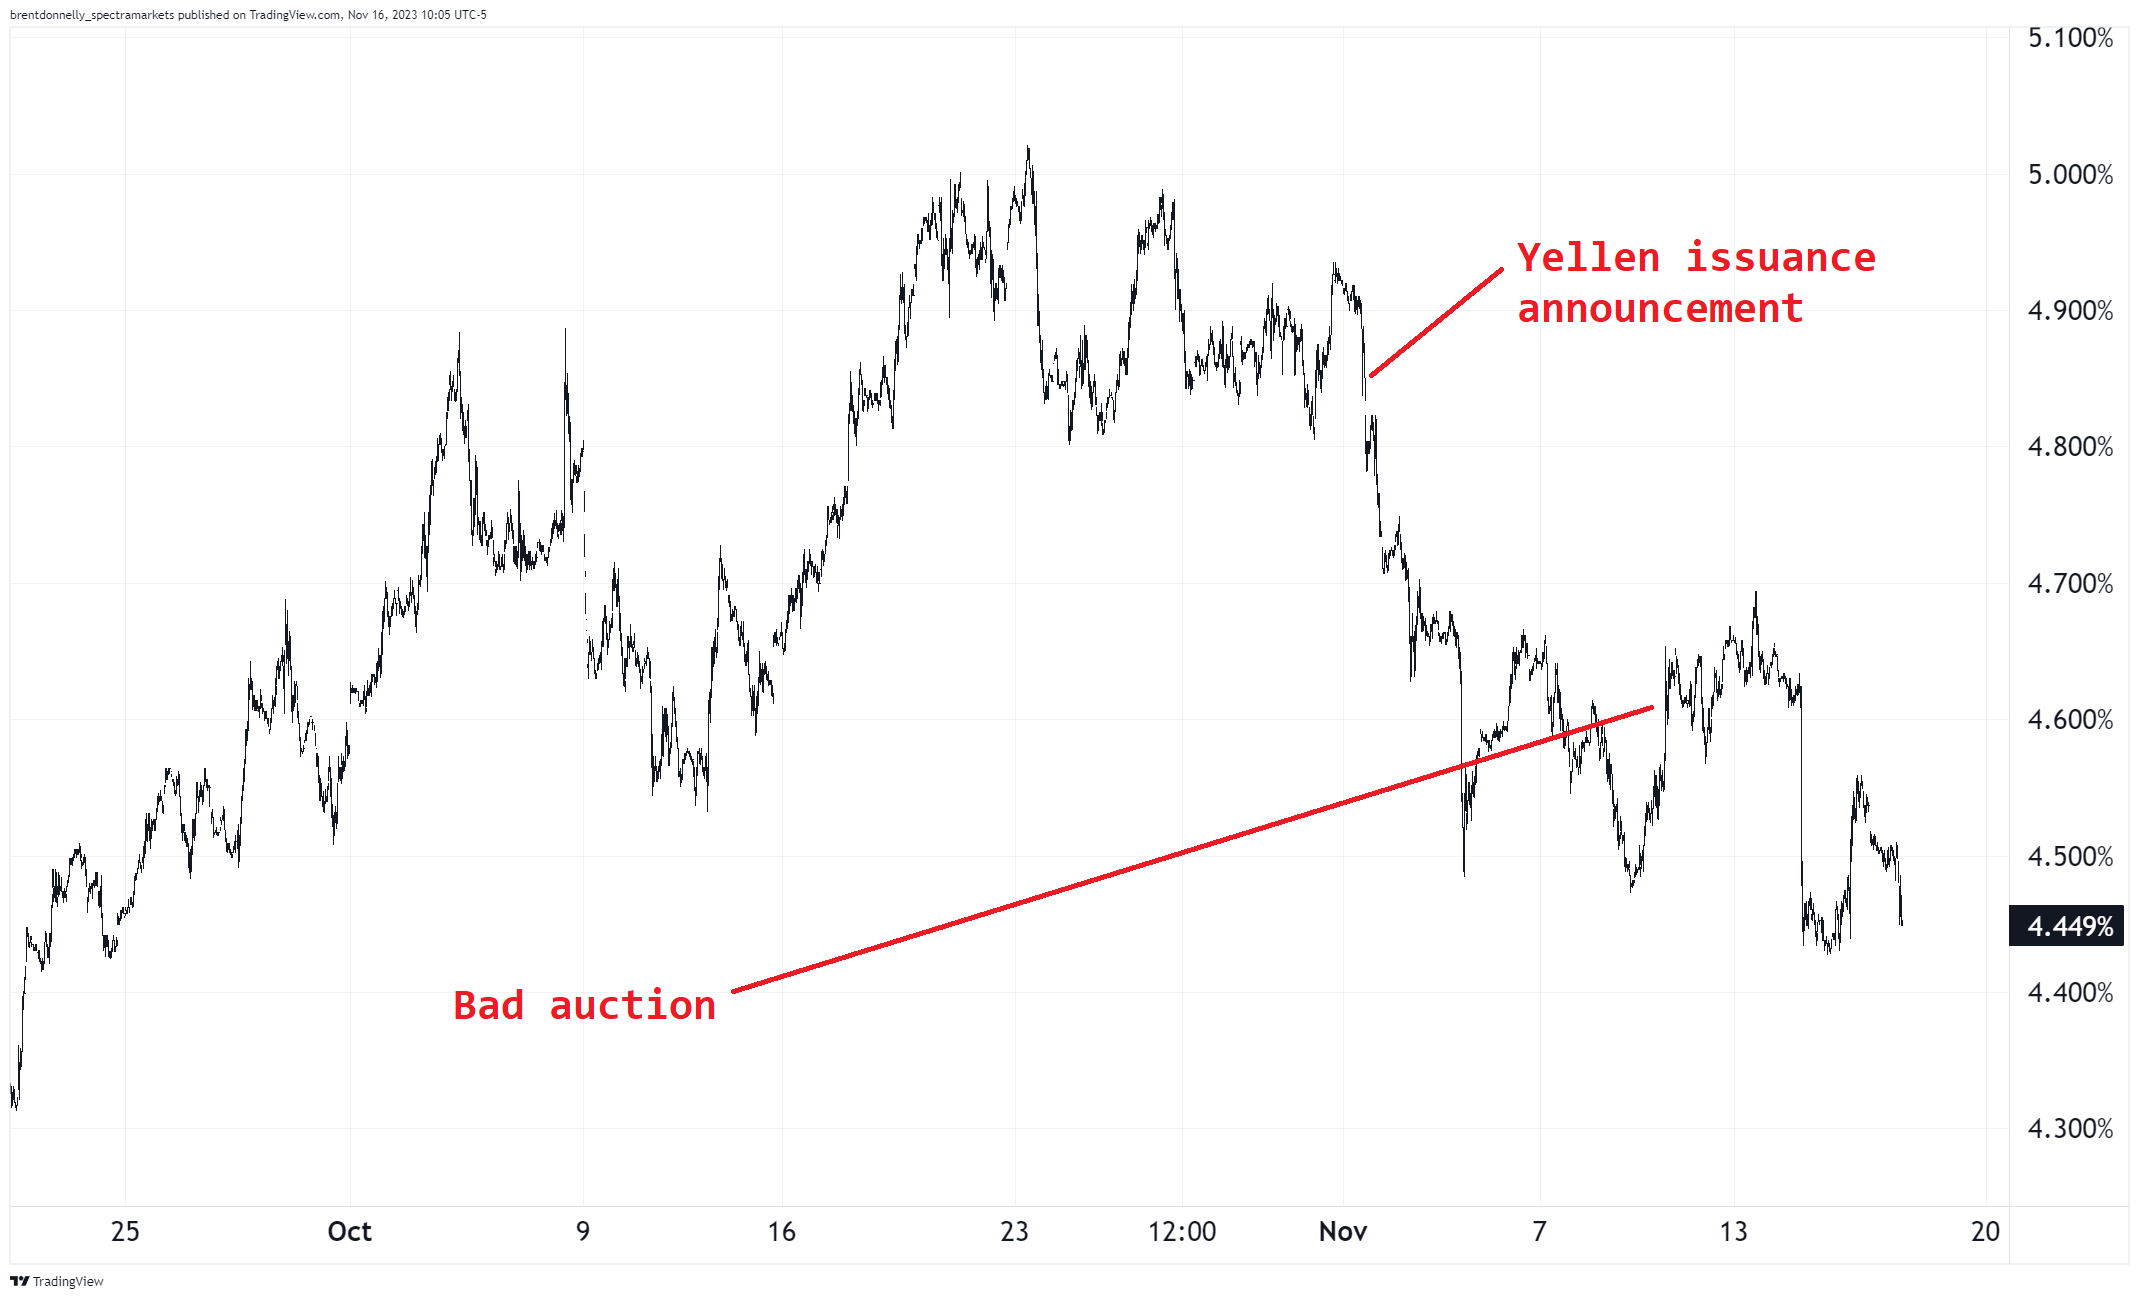
As discussed last week, the bad bond auction is a fly on the butt of the Fed and Treasury joint message that further accelerations higher in bond yields are not welcome.
US 10-year yields, 15-minuter back to late September
The US data has cooled enough to reinforce the move lower in yields, but further drops are going to be tougher to come by now because things are still fine. If things turn less fine, 10-year yields could go to 3.5% but for now i think 4.30/4.35% is where we stop. That is the level we peaked at in October 2022 and very often old resistance becomes new support.
US 10-year yield, daily chart back to Q2 2022
Expect quiet next week with US Thanksgiving and not much on the data docket.
Fiat Currencies
The USD is trying to make a turn lower. This is a good environment to be short dollars and I have been pitching that view in am/FX into and after CPI. When the US is slowing, but not cratering, and the rest of world is picking up off a low base, you tend to see the USD sell off.
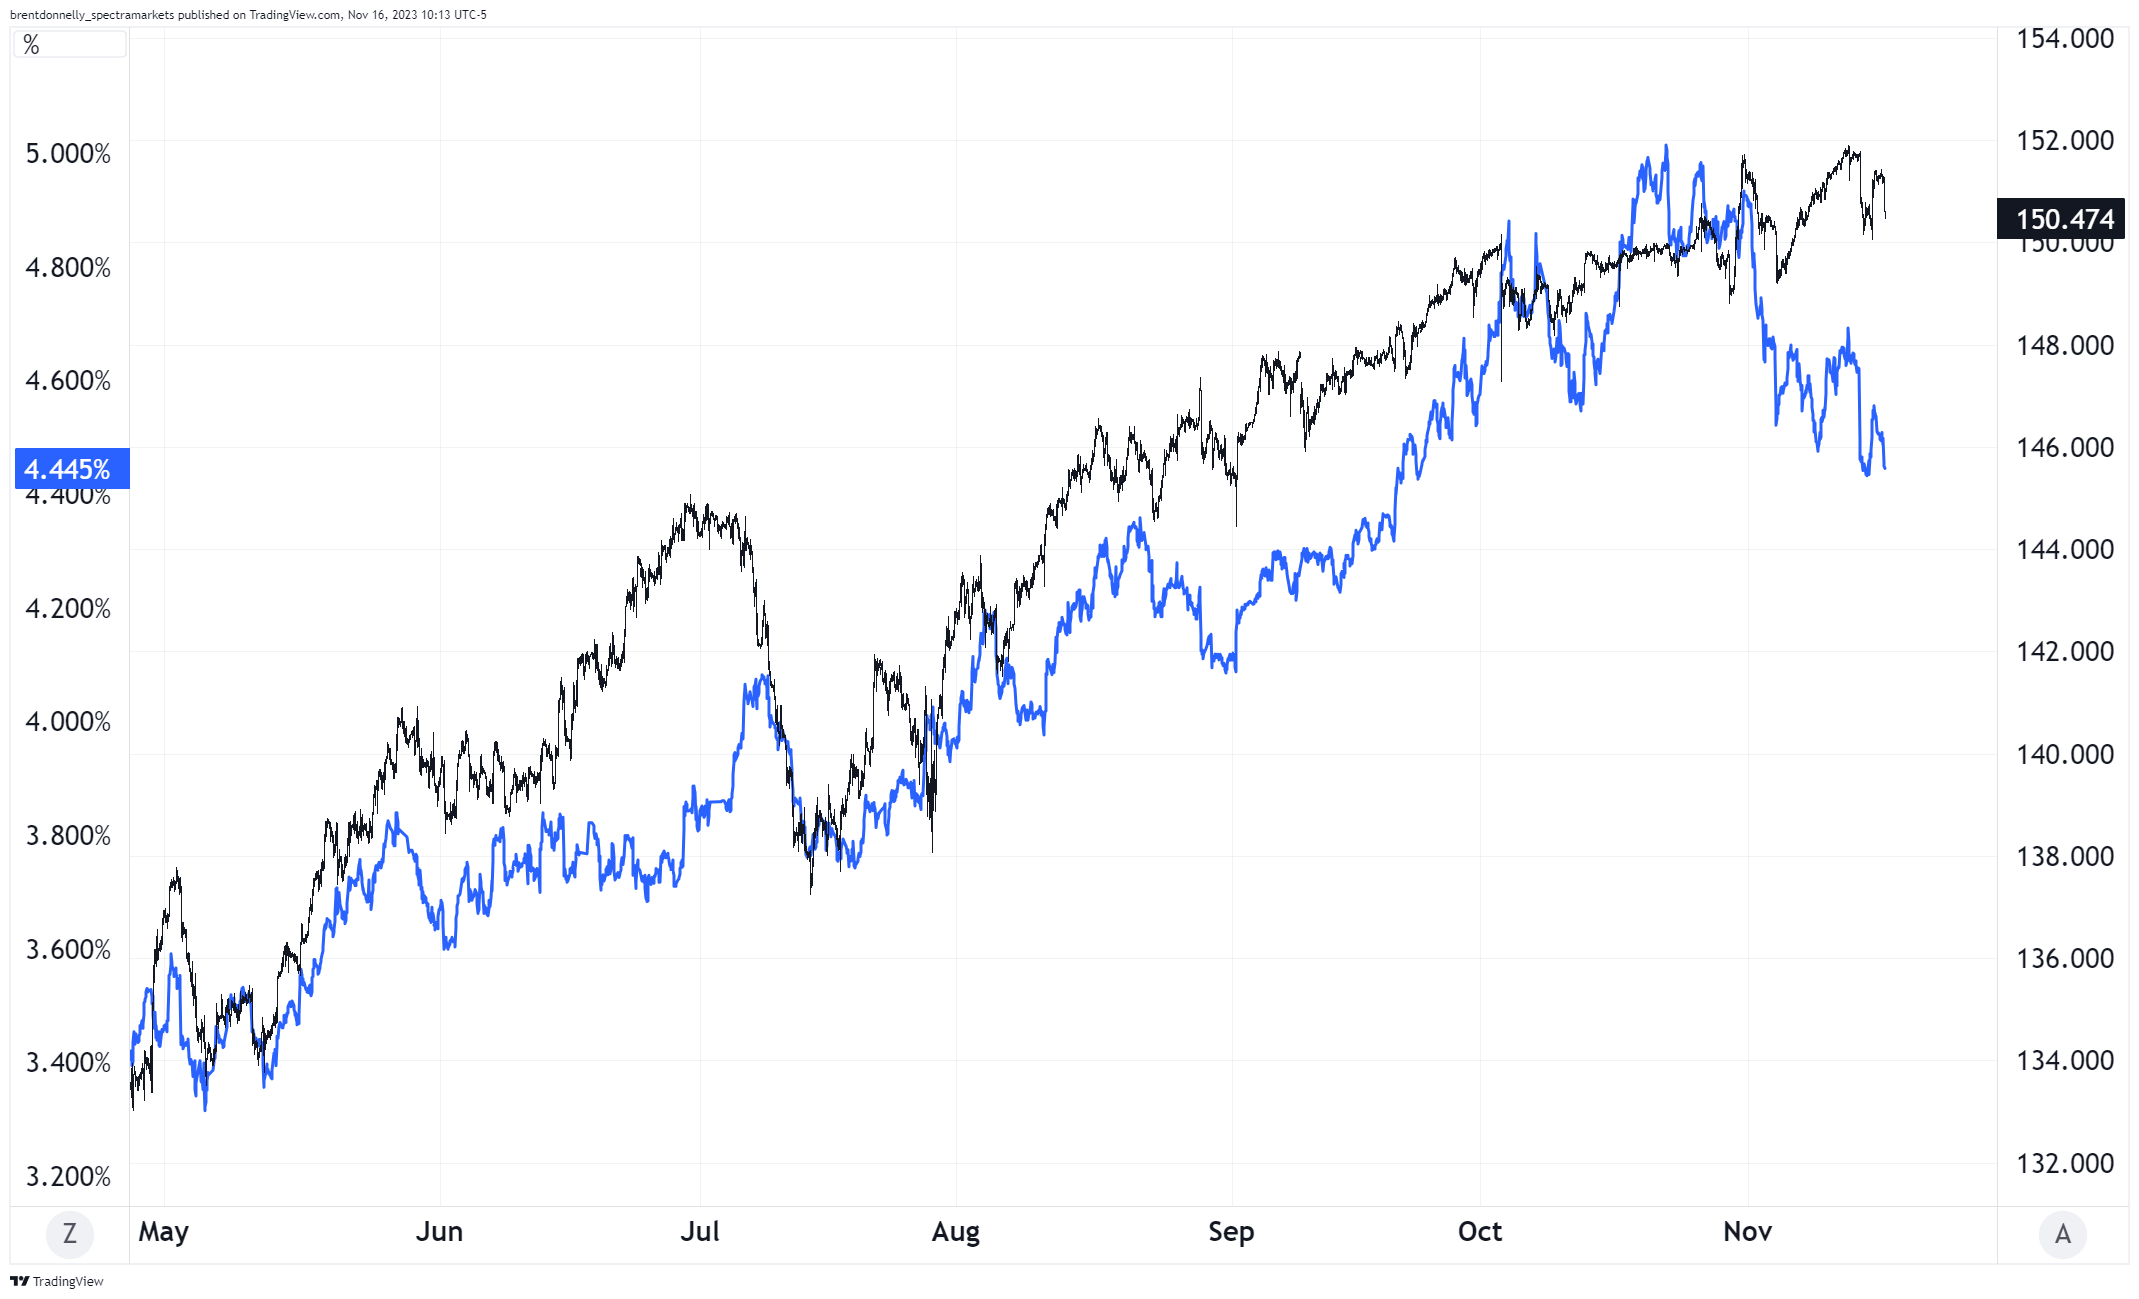
Even USDJPY, the SOL of G10 FX, is selling off now and my view is that long USDJPY is the most crowded trade in FX. People love the carry and carry is important, but when the price drops 2% in one day, it’s easy to get nervous. I think USDJPY is headed back to 147/148 in line with lower yields. The rapid fall in the price of oil also has some ramifications for USDJPY (bearish).
USDJPY vs. US 10-year yield (blue), May 2023 to now
The dollar tends to perform very poorly into the end of the year, so that’s another reason to be short USD. Not investment advice, just my current view which could change at any moment.
Crypto
Waiting, watching the clock… Everyone and their aunt in Tuscaloosa is long BTC for the buy the rumor / sell the fact trade and while that is perfectly logical, it creates this uncomfortable waiting period here where knuckles are turning a bit white as we wait for the inevitable announcement(s).
Question for you: Will a spot ETH ETF lend out the ETH and generate a spicy yield? Or no. If it does, that could be a big step towards the bond-like security moment for ETH. I would be more likely to own a spot ETH ETF if it was paying me 4%/year.
While everyone is focused on BTC, maybe ETH is the better play? I’m not an expert in this domain so feel free to respond in the comments with your view on why this is a good or stupid idea.
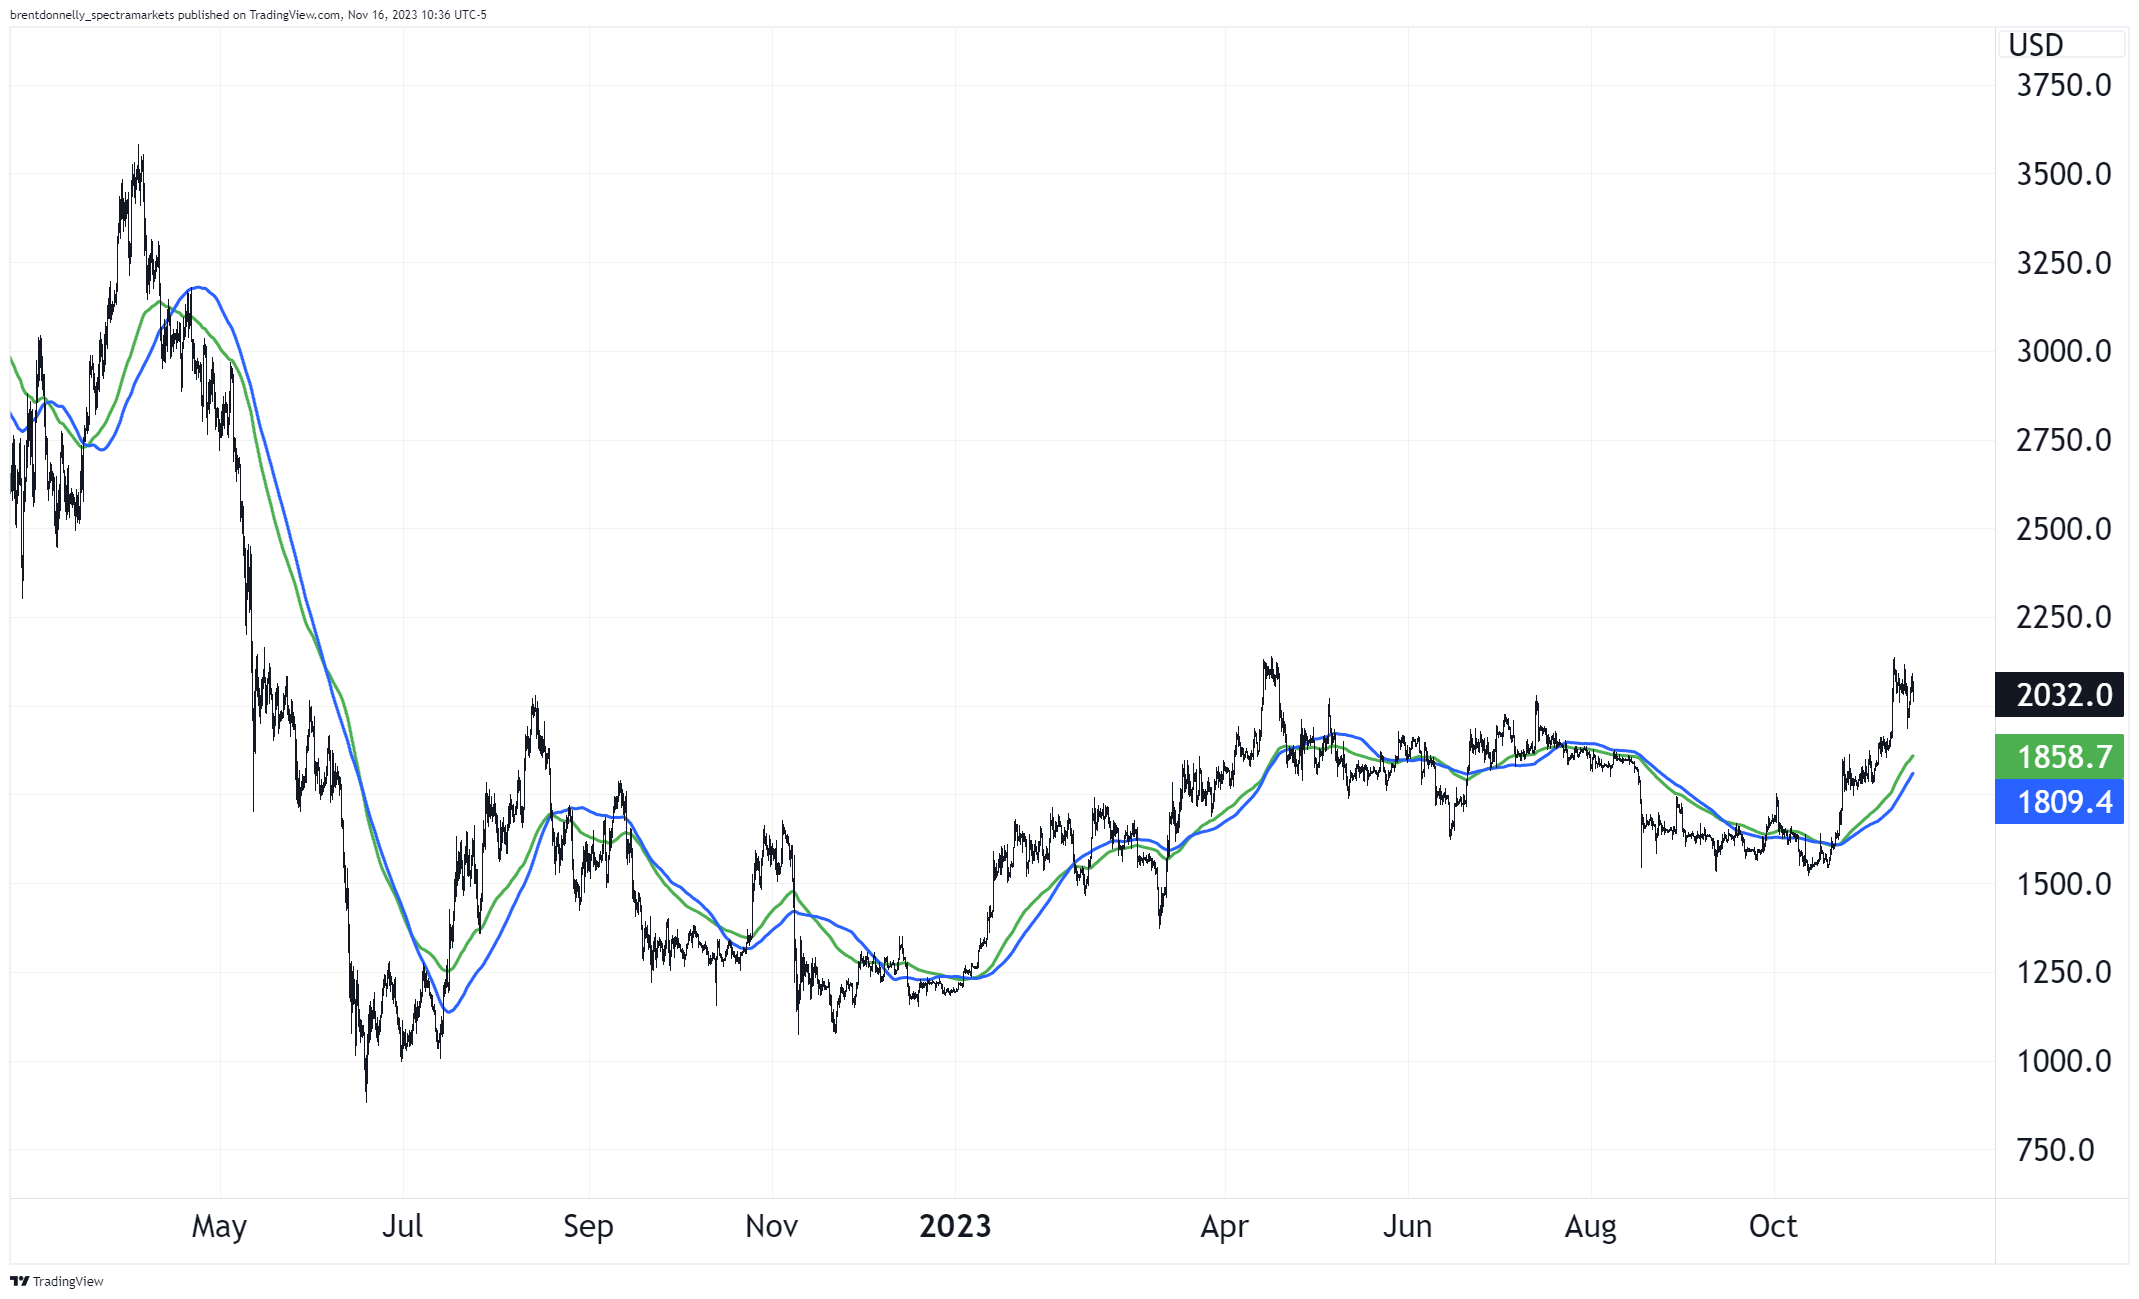
Looking at the ETH chart, we have spent the majority of the post-crash period (May 2022 to now) in a 1000/2145 range. Through 2150 could be lunar.
ETH 4-hour chart, April 2022 to now
Also, crypto volumes are picking up a lot. That’s good for the ecosystem. Here’s a chart from The Block.
Total crypto volumes (7-day moving average)
Commodities
Oil is skittering lower inside familiar ranges as the market shows us, once again, that trading geopolitics is a short-term approach that rarely yields useful macro trades. The half-life of geopolitical angst is short, and real world supply and demand dominate over short-term specs punting on war news.
NYMEX Crude Oil with 200-day moving averages (simple in blue, EMA in green), daily chart back to September 2022
Gold is regaining a foothold and continues to coil below the most epic of all epic levels, 2080. Leave some buy stops at 2100 for an explosive move that might never look back. I would rather be long on the break of 2100 than long here into the massive 2080 triple top. Sure, you miss $100 of the move but I think your EV and risk/reward are much better if you wait for the topside break.
If you take sugar in your coffee, you’ve been nicely hedged since late 2022.
Coffee spot price (black bars) vs. sugar spot price, daily back to mid-2022
OK! That was 5 minutes. Please share this Substack with any aspiring finance professionals that you know! Thanks!
Get rich or have fun trying.
Links of the week
Drole
https://x.com/Thinkwert/status/1724244584153145716?s=20
Smart / interesting
A good article by Claudia Sahm:
Cool, short video about the evolution of FIFA (the video game)
https://www.wired.com/video/watch/wired-news-and-science-fifa-hypermotion
One of my seven favorite songs of all time
It’s hard to explain how ahead of its time this song was when it came out in 1991. This is a decade before Daft Punk, or the rise of EDM and progressive house. The song was like nothing else that existed at the time. And it holds up.








This is such a good macro letter. Better than 90% of the dead-serious ones I've seen.
Kick ass charts and analysis Brent. I’ll be buying the almanac with my next paycheque.