


Friday Speedrun: October 6, 2023
Bond vigilantes keep smashing the sell button

Hello. It’s Friday. Thanks for signing up. I’m Brent Donnelly.
The About Page for Friday Speedrun is here.

Here’s what you need to know about markets and macro this week
Global Macro
The only thing people in markets care about right now is the rise in global yields. It all has a bit of a disorderly feel to it as the back-end (longer-dated) maturities are getting hit, particularly in Japan and the US. Some of those bonds have lost 50% of their market value.
Check out this chart, for example. A bond that was issued three years ago near 100 is now trading at 46. Sacré bleu!
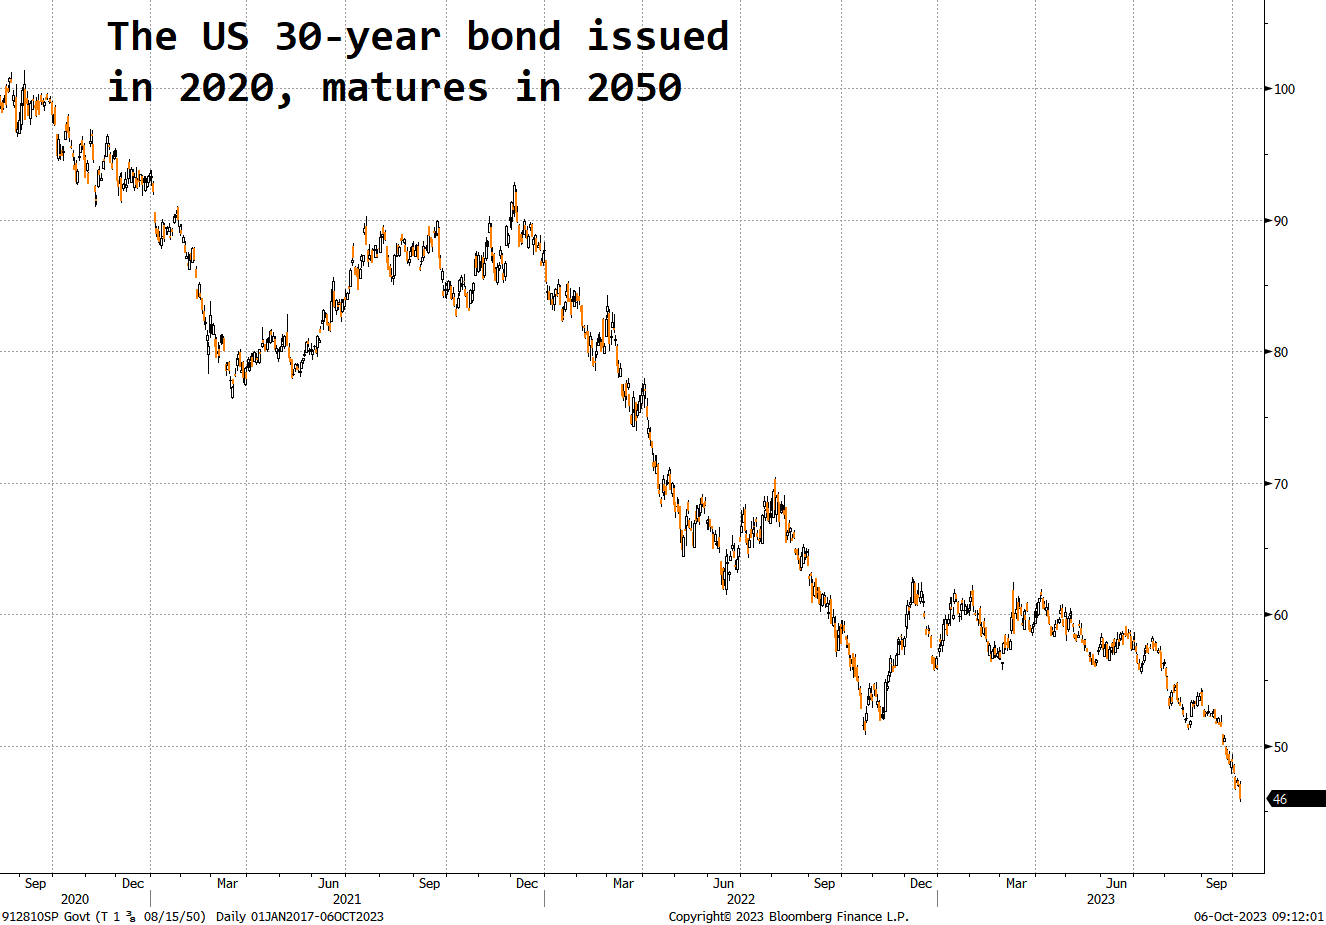
That is an eye-watering move, though it’s worth noting that the move in 2022 was faster and bigger than the move this year. As a general rule of thumb, when yields are going up very quickly, people get scared and sell stocks, risky assets, and liquidity thermometers like gold and silver.
The level of rates matters, too, of course, but quite often the angst comes mostly during the upward repricing of yields and once they find their new, higher happy place people calm down.
There was some economic data this week, including strong US and Canadian jobs reports today, plus some mildly encouraging PMI data out of the UK earlier in the week. The thing is, the data doesn’t matter that much right now as the selloff in bonds is only partly related to the unexpected strength in the US economy. Some of the move in bonds is also attributable to a big mismatch between supply and demand. Supply is relentless and most of the people that wanted to buy bonds already did so at much worse levels.
These supply / demand stories are pure momentum trades as the market continues to auction the price of bonds lower and lower, day after day, until finally, motivated buyers appear.
There also seems to be a (somewhat loose) relationship between Gross government debt and the size of the yield moves in various countries. It looks like the bond vigilantes are selling the worst fiscal offenders with the most gusto. Part of the big move in Japanese bonds is also just because yields in Japan were so incredibly low and they barely ever moved in the 2010-2019 period. So now that they are on the move, it’s attracting a ton of attention.
Gross debt to GDP vs. Change in yields since 12JUL23

As interest rates rise, government debt to GDP matters because interest costs will suck up a greater portion of countries’ federal budgets in direct proportion to the size of the debt times the yield. If you have a huge pile of debt, higher rates hit you harder than the frugal country with less onerous future obligations.

That chart is from the IMF. I modified their color scheme a bit because it featured too much beige, and the chart looks much more alarming when you put the worst offenders in red—and I know secretly you love to see alarming charts, not beige ones.
I find myself torn on this issue because ballooning US and Japanese debt has been an evergreen doom and gloom story since 1985 or so, but if the market cares about it, I will start to care about it. And the market cares about it now.
Does the scatter plot above show a decisive relationship between yield changes and debt/GDP levels? Not really. Japanese yields are probably going up the most because they were the most suppressed. Does the scatter plot suggest that country debt levels are contributing somewhat to current yield moves? Probably. Swiss rates were just as low as Japanese yields and they are not going nuts.
Maybe the doomers will finally get the debt crisis they have been fantasizing about for the last 40 years.
Stocks
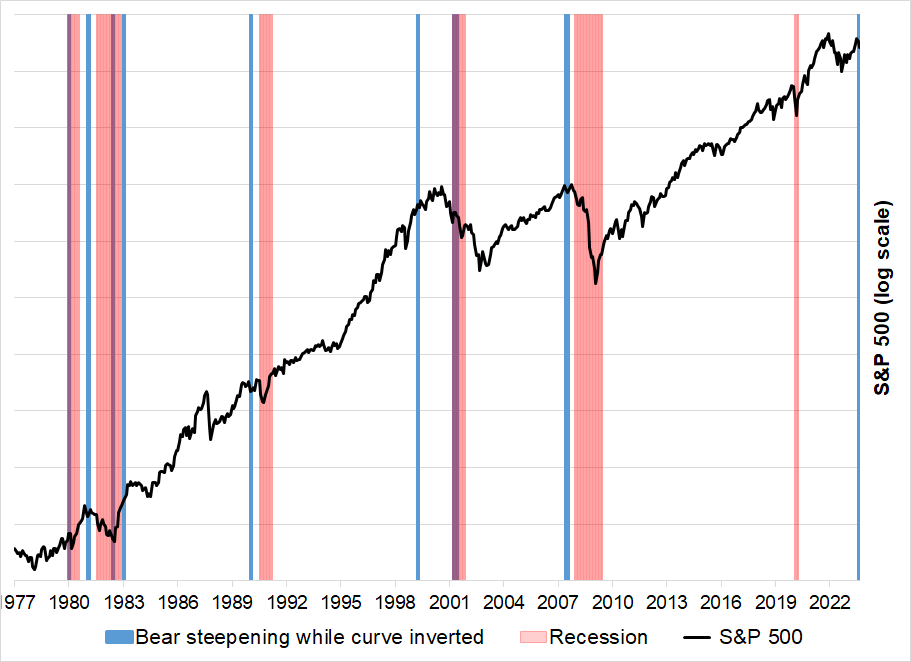
Stocks are holding in very well considering the rise in yields and the scary steepening in bond markets. Bear steepening when the curve is inverted (that is, long-dated yields are going up faster than short-dated yields (steepening) at a time when short yields are above long yields (inverted yield curve)) tends to imminently precede recessions and is a better timing indicator than an inverted yield curve on its own.
Bear steepenings during inversion often warn of imminent recession
Some interest-rate-sensitive sectors, like utilities, have been decimated but tech stocks and the indexes in general have held in surprisingly well. And we have a bullish setup where stocks are extremely oversold, even though they haven’t really gone down that much.
S&P futures (black) vs. % of S&P 500 stocks above their 50-day moving average (blue)

Stocks are finally about to enter the most bullish time of year (October 9 to end of the year). Adding to the odds of a stock market reversal is that (as you can see in the chart above) just 7.35% of S&P 500 stocks are above their 50-day moving average now. That’s a condition that has seen large rallies in the past.
The only other moments in the past 10 years when the % of stocks above the 50-day number was <10% were: March 2020, December 2018, January 2016, and August 2015. Those were all epic buying opportunities.
It feels kind of illogical to be bullish stocks but there are quite a few technical and seasonal reasons to do so. And the market very often does “illogical” things, usually to the topside.
Here is this week’s 14-word stock market summary: Oversold, trying to make a bottom. Many smart reasons to be bearish, as usual.
Interest Rates
The start of Friday Speedrun mostly covered what’s going on in interest rates because they are driving the bus right now. Speaking of driving the bus, if you have kids in the 6-to-10-year-old bracket, the book Don’t Let the Pigeon Drive the Bus by Mo Williams is fun.

I think the most important level in bonds is the 4.80%/4.90% zone where US 30-year yields topped after the Global Financial crisis. We are trading at 5.0% in the 30-year right now, and if we close up here, people are going to be nervous next week into CPI.
US 30-year yield, 1991 to now

An interesting feature of the current regime is that corporate credit spreads (the risk factor attached to corporate bonds to compensate for non-payment/bankruptcy risk) have not widened. Normally when people are freaking out about the economy, spreads widen and bankruptcy odds rise.
10-year BAA Corporate Bond Spread
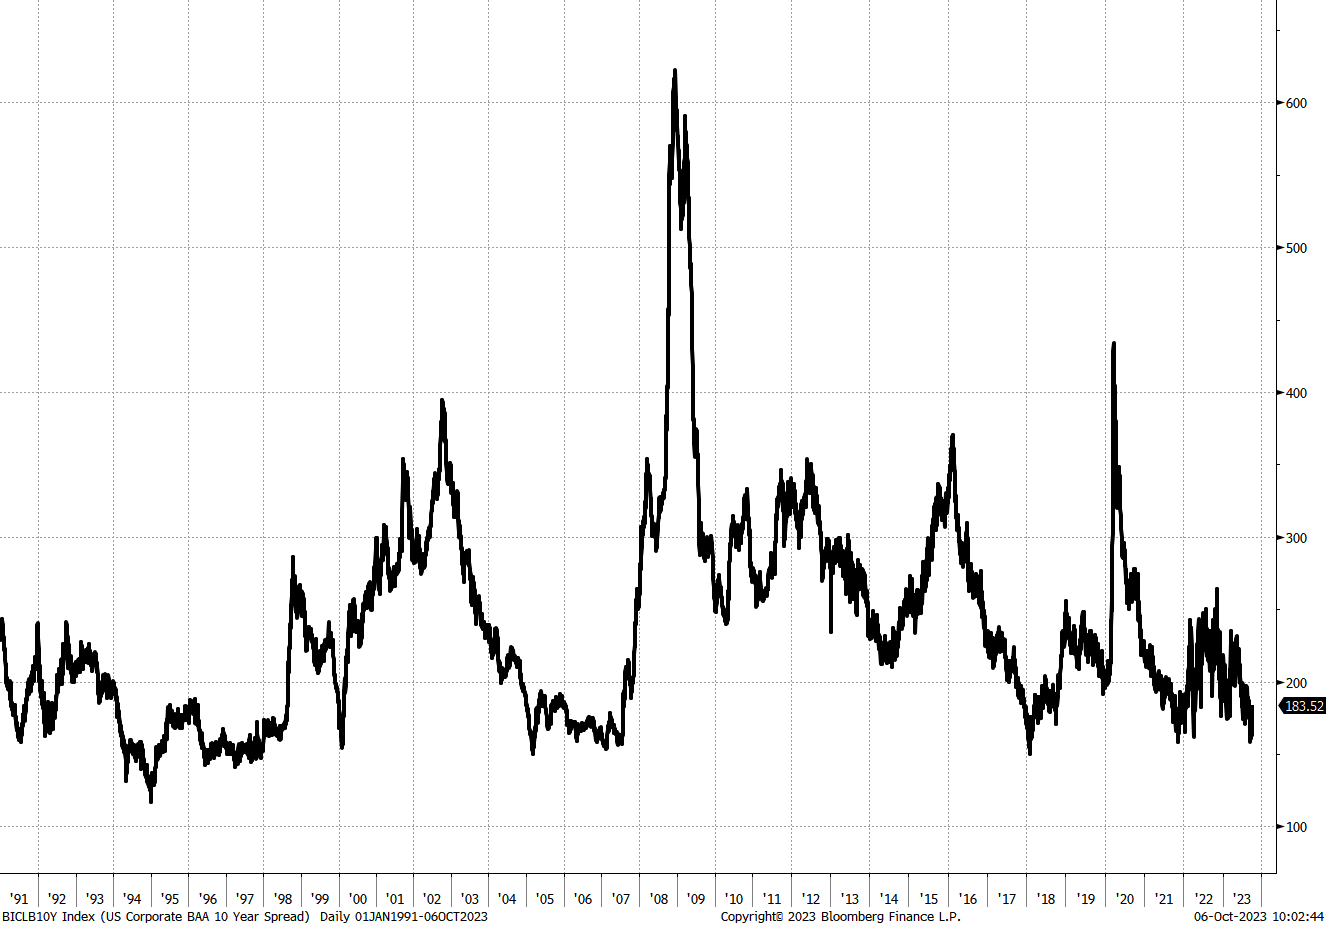
So while many commentators have been dreaming of imminent recession all year, credit markets are not priced for stress. Markets can be wrong, of course, but maybe this is an accurate reflection of strong corporate balance sheets, a strong US economy, and the fact that many corporations rolled their debt at super-low levels when yields looked like bagels.
Fiat Currencies
King Dollar continues to rampage through the FX jungle and few currencies are spared his wrath. The notable feature this week was that while the USD was rallying against G10 (something we’re used to) it also went wild vs. emerging market currencies.
Mexico has been an FX darling all year because it offers juicy carry and leverage to a strong, reshoring US economy. But carry trades are called “picking up nickels in front of a steam roller” for good reason.
USDMXN daily, 2023

That is called skew. That’s why USDMXN calls cost more than USDMXN puts, generally. Volatility is not symmetric.
The other highlight in fiat world this week was a quick boot to the head of USDJPY, delivered by a Ministry of Finance (MOF) rate check. When the MOF wants USDJPY to go down, they usually start by calling banks and asking for a rate in USDJPY. They don’t actually sell dollars, but the rate check is a strong signal that shows they are willing to sell dollars soon. It’s a warning flare to the market like: “Hey! Stop buying USDJPY!”
Take a look at this next chart and see if you can spot where they did the rate check.
USDJPY 5-minute chart, 20SEP to now

If you cannot see the rate check, please try harder.
Crypto
The ghost of SBF is haunting my feed this week as he goes to court right as Michael Lewis releases a disastrously unpopular book/time capsule about SBF’s pre-fraud glory days.
Bitcoin is doing the 25k/30k thing, ripping the faces off the shorts but not really making any meaningful progress. It seems to have divorced from risky assets, the dollar, and gold and it’s now just happy to go nowhere on low volumes. This makes for some zippy short-term trades but it’s hard to extract much signal from the noise.
Bulls could definitely argue that it’s good news that crypto is holding in despite a strong dollar, higher yields, and a huge drop in gold, but for now it seems more like it’s just pegged 25k/30k and macro has lost its impact as participation and interest wane.
I’m still waiting for a useable Web3 app to cross the chasm from early adoption to actual use in the world

The 200-day moving averages have been good in bitcoin and we keep smashing into them but not getting through. Keep an eye on those because if we close above them, that could be a sign that BTC is ready to resume its preordained destiny and do its best Neil Armstrong impression as it resumes its voyage to the moon.
BTC daily with 200-day moving averages (simple and EMA)

.
Commodities
I believe it’s not cool to do victory laps on your good calls unless you are open about your bad calls. I am open about my bad calls so let me do a victory lap on something I wrote in Friday Speedrun last week:
… the easy / fun part of the bullish oil trade on Saudi supply reductions is probably over. We are back to the top of the range and stalling, while few believe Saudi Arabia wants oil meaningfully up through $100. If you’re long oil, this isn’t a bad place to take some money off the table.
And here’s what happened

Neat.
While I mentioned earlier that crypto has held in well in the face of heavy headwinds from yields and the USD… Commodities have not.
Precious metals, base metals, and energy prices all got slammed this week. Gasoline prices are absolutely cratering. What about RBOB?
RBOB Gasoline Futures, early September to now

This came on the heels of a report showing that seasonally adjusted US gasoline demand is at a 25-year low right now. The commodities all have different stories but if you look at a gold chart, it looks exactly like that RBOB chart. The textbook says that Mars-bound yields and a strong USD are bad for commodities. This week the market followed the textbook.
OK! That was 6 minutes. Please share this Substack with any aspiring finance professionals that you know! Thanks!
Get rich or have fun trying.
Links of the week
Interesting / smart

A strange and intriguing academic paper
https://papers.ssrn.com/sol3/papers.cfm?abstract_id=4322134
Thank you
Thank you Brent, great as usual!