


Friday Speedrun: September 15, 2023

Hello. It’s Friday. Thanks for signing up. I’m Brent Donnelly.
The About Page for Friday Speedrun is here.

Here’s what you need to know about markets and macro this week
Global Macro
Before we get started: Happy anniversary to everyone who worked at the Brothers in 2008. Today is the 15th anniversary of the day that Lehman died.
I still have many fond memories of those days. Even the bad days at Lehman are good memories now.
Global macro traders had three main themes on their minds this week:
US inflation is holding in and maybe even bouncing back.
The ECB is done hiking, probably.
Aaron Rodgers suffered a season-ending ACL injury

The wicked emotional roller coaster ride for Jets fans reminds me of one of my favorite pieces of writing of all time. A Chinese fable with much wisdom:
There was once a farmer in ancient China who owned a horse. “You are so lucky!” his neighbors told him, “To have a horse to pull the cart for you.”
“Maybe,” the farmer replied.
One day the farmer forgot to latch the gate and his horse bolted. “Oh no! This is terrible news!” his neighbors cried. “Such terrible misfortune!”
“Maybe,” the farmer replied.
A few days later the horse returned, bringing with it six wild horses. “How fantastic! You are so lucky,” his neighbors told him. “Now you are rich!”
“Maybe,” the farmer replied.
The next week, the farmer’s son was breaking in one of the wild horses when he fell off and broke his leg. “Oh no!” the neighbors cried, “such bad luck!”
“Maybe,” the farmer replied.
The next day soldiers came and took away all the young men to fight in the war. The farmer’s son was left behind due to his injury. “You are so lucky!” his neighbors cried.
“Maybe,” the farmer replied.
Speaking of China, they cut their RRR, which is similar to a rate cut as it frees up more money for the economy, in theory. This is another in a series of tiny steps China has made to shore up their structurally damaged economy. A few markets reacted, but the general vibe on China is that there are no easy fixes and only the passage of time will inform us as to whether or not they can engineer a slow and organic rebound in consumer confidence.
Raging bearishness on China has given way to a more modest and less confident general view as authorities seem determined to fine-tune the cyclical story as necessary without engaging in any resumption of the continual pumping of structural stimulus that was taken for granted if ever there was a pullback in growth between 2009 to 2020.
AD

am/FX is my daily macro note that goes to a couple of thousand traders and investors. Learn more, faster. Subscribe here.
END OF AD
Stocks
Apple remained soggy this week, but the broader market is sniffing around near the early August highs as we continue to see US data that good enough to make the recessionistas cringe and yet not so good that it’s scary. Extremely strong data in the US right now would be bad for stocks because it would up the chance that we get more Fed hikes and even higher real rates. But middle of the road data is Goldilocks for stocks as it knocks back recession odds without pushing up Fed hike probabilities. OK growth, no more Fed hikes, and China and Europe still adrift, half-sunk but not rapidly sinking. Stocks are fine with that.
The Apple chart did not improve. In fact, this price action despite a rally to 5-week highs in the indexes makes Tim Apple’s company look even more sus than it did last week when it was just selling off in tandem with the NASDAQ.
Apple common stock, hourly back to April 2023

Note over there on the left how 170.50 was a clear topside breakout in May and it held three times (denoted by the weird star icons). You now have two perfect gap fills on that chart, and it’s closing close to the lows while the indexes close near the highs. Bearish.
Also worth noting: We are about to enter the worst period of the year for stocks. This is a period where you go from the SPX normal win rate of 53% to nearly a month where the daily win rate is 48% since 1980. That sounds small, but it adds up and creates one of the few windows of the year where the EV of long stocks is negative.
This, of course, assumes you believe that seasonality works out of sample, which I do. Still, it’s a clue, not the answer to stocks as there are plenty of times the market goes up in that 16SEP - 09OCT window as you can see in the chart from 1980 to 1990, for example. The chart shows how you do if you’re long stocks 16SEP to 09OCT every year.
I am using the gigantic images function in Substack this week for better chart viewing. Please let me know in the comments whether this is:
a) easier to read; or
b) obnoxious/painful on the eyes or brain
Running P&L of long S&P 500 from September 16 to October 9, 1980 to now

Here is this week’s 14-word stock market summary:
Maximum complacency entering the weakest seasonal period of the year for stocks isn’t bullish.
Interest Rates
Back end (longer-term) yields didn’t move too much this week, though it is important to note that we made yet another strong push at the 4.33%/4.35% area in the US 10-year and rejected it once again. First chart is for the 30000-foot view and the second chart is the same thing, but zoomed in.
US 10-year yields, served two ways

That flickery rejection on CPI was a just algos gone wild, but it shows you that there are plenty of buyers of bonds at these levels, for now. If the market was caught long or there were no buyers, we would have blown through.
Going a bit more in the weeds, yesterday’s ECB meeting saw a rare reaction where the second euribor contracts sold off 3 ticks while the sixth contract rallied 9. Euribor contracts tend to move together, up and down, but when there is a specific change of view around the curve, things can get zippy.
ER2 (the second contract) is ERZ3, which is December 2023. ER6 (the sixth contract) is ERZ4, which is December 2024. The fall in ER2 and the rally in ER6 tells you that the market wasn’t sure about a hike this year, and got one… But the hike itself propelled a rising probability of cuts by the end of 2024. This is price action associated with a policy error. The market thinks the ECB has gone too far with hikes and will therefore now need to cut more in 2024.
The market is not always right. It was right when it took a similar view after ECB hikes in 2008 and 2011 but it was wrong when it tried to call bullshit on the ECB in 2022.
This chart shows all the times ER2 sold off 3 or more ticks on the same day as ER6 rallied more than 8 ticks.
ECB policy rate (blue) and times that ER2 down < -3 and ER6 > +6 (vertical gray bars)
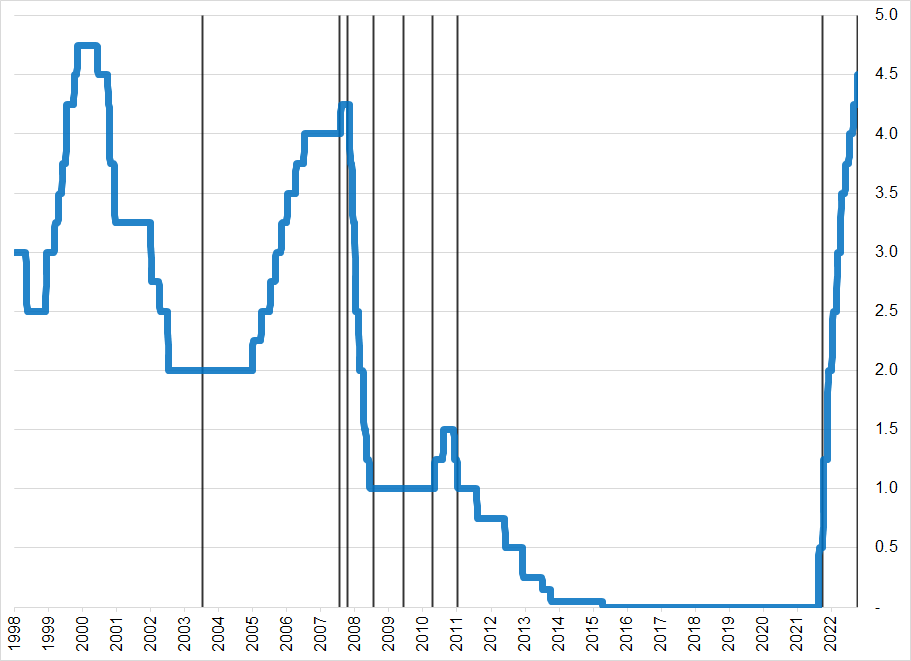
I don’t know what that was in 2003, bu you can see that starting in July 2008, when the ECB was hiking due to all-time highs in oil, the hike was ill-advised. It was one of the great policy errors in the modern era of central banking. The market called bologna in the mini hiking cycle during the Eurozone crisis in 2010-2011, too. The market was right and the ECB was wrong again.
In September 2022, with the energy crisis about to explode and Liz Truss saying “lettuce cut taxes and spend more,” the market called BS on the ECB but the ECB was right. The energy crisis was a red herring, European winter was warmer than a Cinnabon, and the ECB hiked a jillion more times.
The odds are high that the market is right again this time, IMO. The ECB is hiking into recession and this looks like a classic late-cycle insurance hike that is likely to be unwound pretty quick if economic momentum does not turn 180 degrees in Q1.
Fiat Currencies
The big move was the euro as the ECB looked like it is signaling an end to rate hikes. Their reaction function has changed despite very high inflation, still.

The hope is that inflation will drift back towards target as PPI crumbles and the long and variable lags of tighter policy kick in. Good chance they are right, but it’s still a funny chart.
USDJPY tried to go lower on last weekend’s media interview that suggested Ueda might want to hike rates sooner rather than later. Problem is, USDJPY is driven by US rates, not Japanese rates. So USDJPY just ripped all the way back up as US 10-year yields are pushing the top of the range again.
USDJPY (black bars) vs. US 10-year yield (blue line)

At some point soon, the Ministry of Finance is going to intervene in USDJPY. We are in the late stages of yen weakness, I think, as it just offers no benefit whatsoever to Japan anymore. They will push back.
Crypto
Is it possible that the bitcoin ETF is kinda priced in at this point? Like when it gets approved, BTC goes up 2000 down 3000? We must be close as it’s become one of those boring “headlines every day” kind of things.
Hard to get your head around what is driving crypto these days as the old macro factors like the USD and NASDAQ have no explanatory power anymore and we are unchanged in a small range since April.
Bitcoin 90-day realized volatility

Commodities
Saudi Arabia is doing a good job of keeping the upward pressure on oil. It’s not flying, but it’s grinding higher in an extremely stable fashion. We have clearly abandoned the 2023 range that dominated for ages and are coming up on key double top resistance at 93.50 in NYMEX crude.
NYMEX Crude, 2022 to now

Gold had a brief flurry of fun but with rates so firm, it’s just impossible for it to get legs. Need bad news on the US economy to get it back up.
Alright. That was 6 minutes. You’re done.
Get rich or have fun trying.
Links of the week
Flashback 1
15 years ago today

Reminds me of this classic scene:
Flashback 2
I grew up in the time of Wall Street, the movie, and Liar’s Poker. I wanted to be a bond trader at Salomon Brothers. Here’s me in 1995, trying way too hard to look like Gordon Gekko

Excellent, smart article

Music
You wanna get funky this weekend? Check out
And a little “Get Down Saturday Night” courtesy of DJ Delirious.
The bigger charts are great!
'Liz Truss saying “lettuce cut taxes and spend more”', HahAhAHaHaHahA..! Love it. Possibly your best one on FS.
About your question: it reads better for me on Substack, but I'm on a 13" MacBook, it might be a different experience for a trader running really large screens.