


Friday Speedrun: September 29, 2023
Will we get the Santa'ween rally?

Hello. It’s Friday. Thanks for signing up. I’m Brent Donnelly.
The About Page for Friday Speedrun is here.

Before we get started: The 50 Trades in 50 Weeks book is out!
You can buy the 50in50 book right here.
If you would like to know more about it before you buy, check out this page:
https://www.spectramarkets.com/50in50/
Here’s what you need to know about markets and macro this week
Global Macro
This week was a tale of two halves. The week started with a continuation of last week’s FOMC-inspired moves in stocks and bonds, but by the end of the week, the market was over its skis and everything happened so fast that the shorts (of which there were (and still are) many) are caught offside.
There wasn’t much data this week, just a convexity and supply-driven continuation in bond yields. This took the dollar to the highs and stocks to the lows. But everybody knows that everybody knows Q4 is a super strong seasonal period for stocks and now it feels like the market is short stocks, and bullish.
Given there is still a big short base in stocks, and everyone knows that everyone knows about bullish seasonality (see the “Stocks” section below), the first week of October could be a huge up week for risky assets.
Adding potential fuel to the fire is the China data download this weekend. We will get four China PMIs released Friday/Saturday and the China satellite data shows an uptick in September activity in China. The details are not 100% raging bullish but the crux of this story from Bloomberg is as follows:
China’s economy showed signs of a stronger recovery in September, according to several early indicators and a firm analyzing the global economy using satellite data.
Activity around Chinese shopping malls remained at relatively high levels in September following an increase in August, according to SpaceKnow, a US company that analyzes satellite images. A pickup in cement manufacturing, which began in June, was also sustained through this month, the data show.
“We are in the ‘early signs of recovery’ team,” said Jan Pintera, an economist at SpaceKnow. He said satellite imagery showed a “positive direction for the Chinese construction sector” and “renewed consumer confidence.”
Satellite data is a reliable way of tracking activity in non-transparent economies, as explained here and here.
While the US government looks set to shut down, this has been known for ages and should be well priced in. This is the 15th government shutdown in history so it’s hardly a scary event. Here’s what stocks did around the 16-day 2013 shutdown:
S&P 500 in Q4 2013

.
Stocks
Last week’s 14-word summary was: The calendar said stocks would fall and the Fed complied. Big support coming soon. I presented this chart:
NASDAQ, February 2023 to now

And here’s what happened:
NASDAQ, May 2023 to now
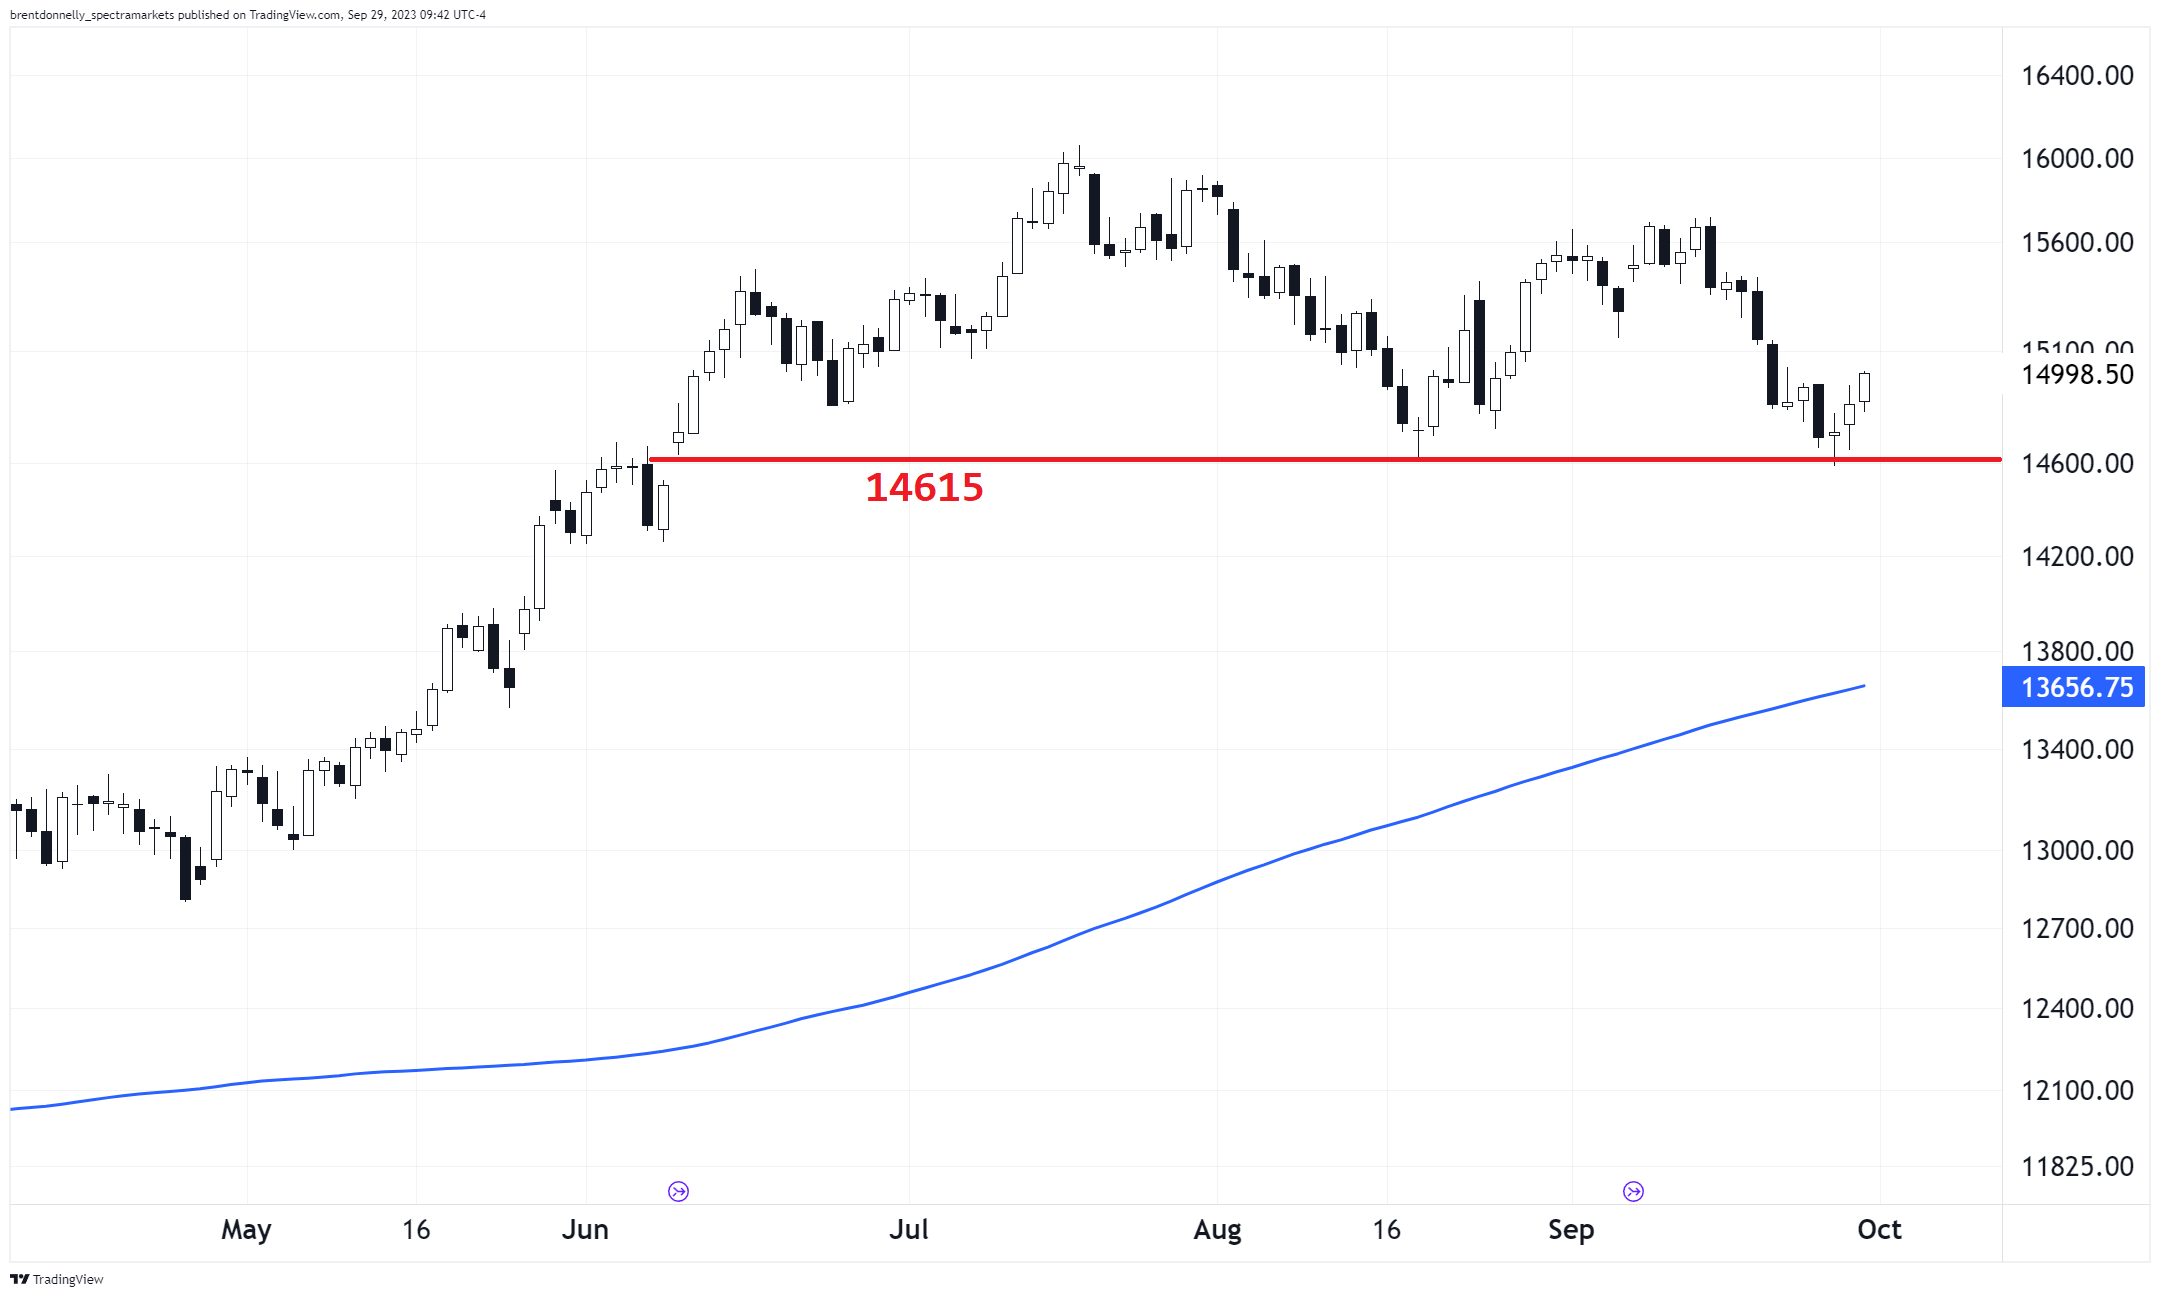
An absolutely perfect textbook hold of horizontal support. I like horizontal lines because they reflect where the big pockets of demand and supply exist in the real world. I explain it more fully in this piece:
https://www.spectramarkets.com/technical-analysis-and-market-structure/
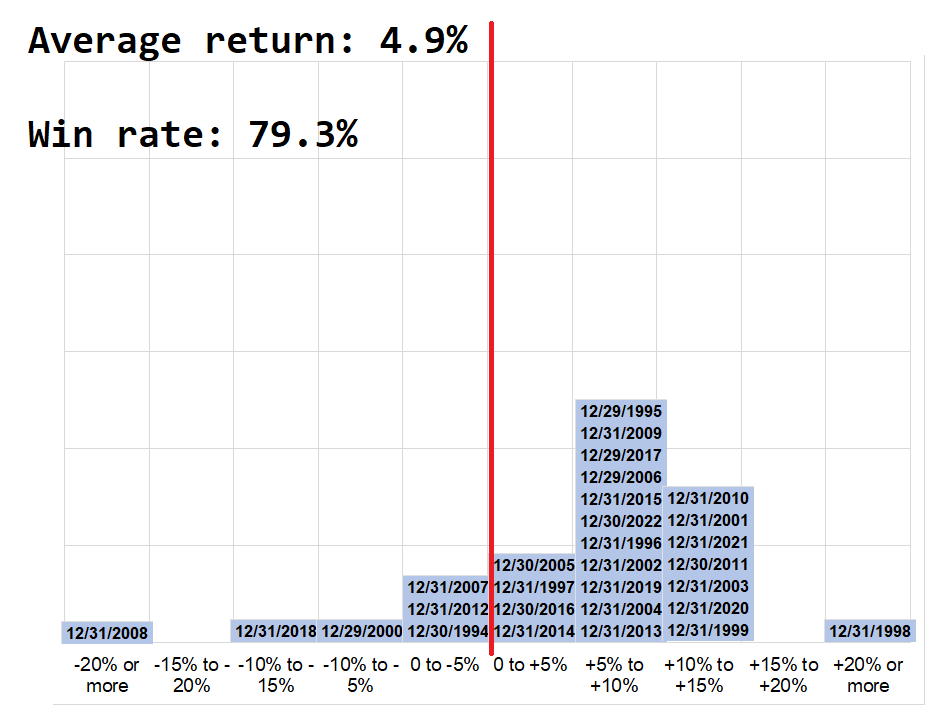
We now enter the very bullish Q4 period with the market still heavily short at increasingly bad levels and China data this weekend could surprise to the upside. Here’s how stocks have done in Q4 since 1993.
The most analogous years in terms of monetary policy would be 2000, 2006, and 2019 as the curve was flat or inverted entering Q4 of those years. However you slice and dice it, the seasonality in Q4 is not conditional. It’s powerful and persistent, though obviously not a sure thing.
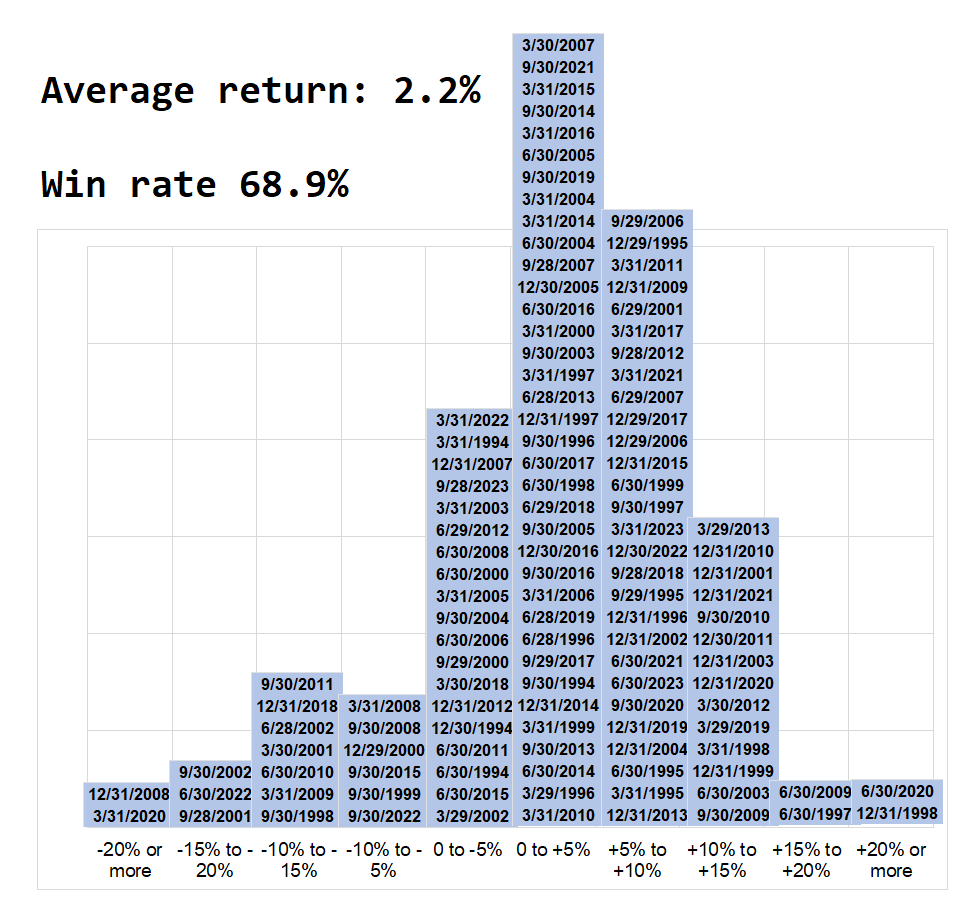
For perspective, here are all quarters back to 1993:
And here’s this year in red vs. the average path of equities since 1995. Following the script perfectly so far.
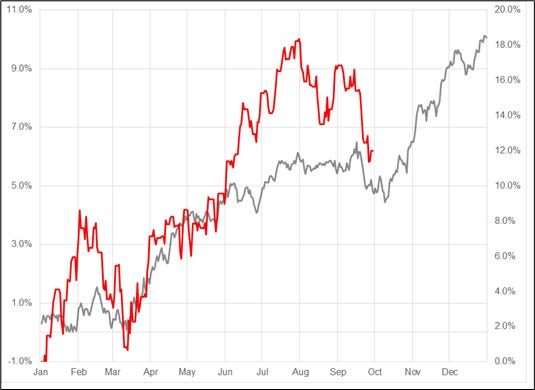
Buying Monday or 1-week calls in whatever risky asset you like best is high EV, I believe. Positioning, seasonality and the positive asymmetry on China data is a nice trifecta. Trade your own view, this is just how I am seeing things right now and my view can always change.
Here is this week’s 14-word stock market summary: Support holds like a rock. Shorts are in for a shock. Welcome to Q4.
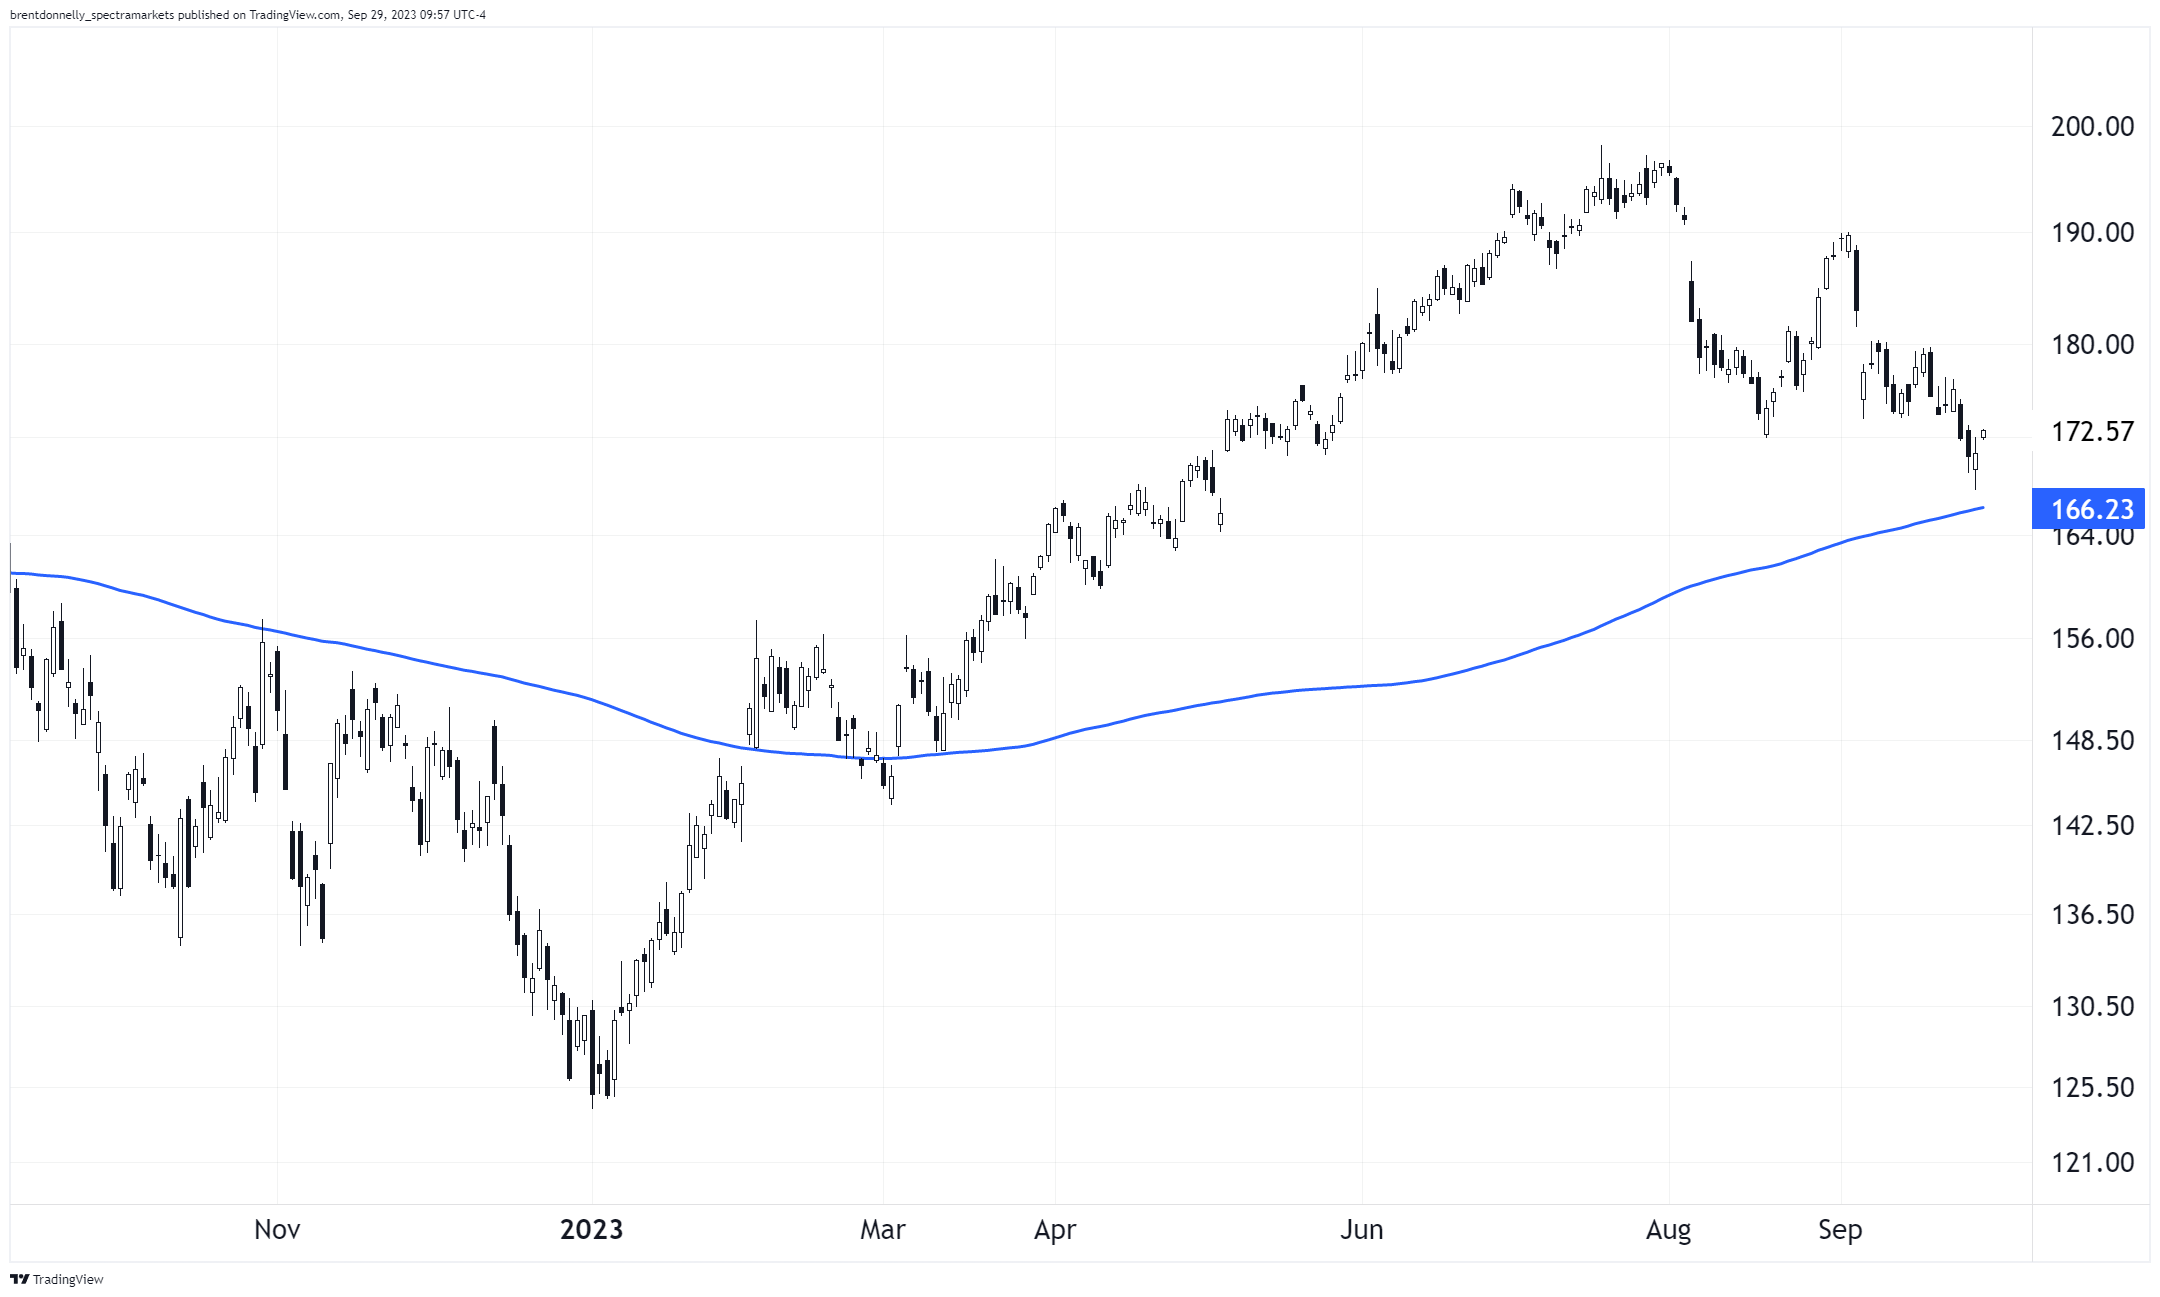
AAPL daily rejects 200-day moving average
Interest Rates
Wild moves in fixed income this week as yields ripped and the curve steepened like crazy. The bond market is mildly broken as quantitative tightening, convexity hedging, a stronger-than-expected US economy, and bond supply created a perfect storm.
While yields going higher can be scary, it’s fair to ask whether normalization is actually good or bad. Oddly, the same people saying that zero rates were going to lead to certain doom are now saying historically normal levels of rates will lead to certain doom. This probably says more about the popularity of doom-and-gloom worldviews than it does about the relevance of yields.
Here’s a less pessimistic way to view US yields:

As US households and corporations remain somewhat insulated from higher market rates (because they rolled their debt at super-low rates in 2020/2021) the monetary policy lags are crazy long. But we have now got through the student loan restart, actor’s strike, UAW strikes, and we know about the government shutdown and yet Initial Claims, the mostly timely measure of the US jobs market, remain generationally low. Things are getting mildly worse off pretty solid levels. The US economy refuses to die.
Fiat Currencies
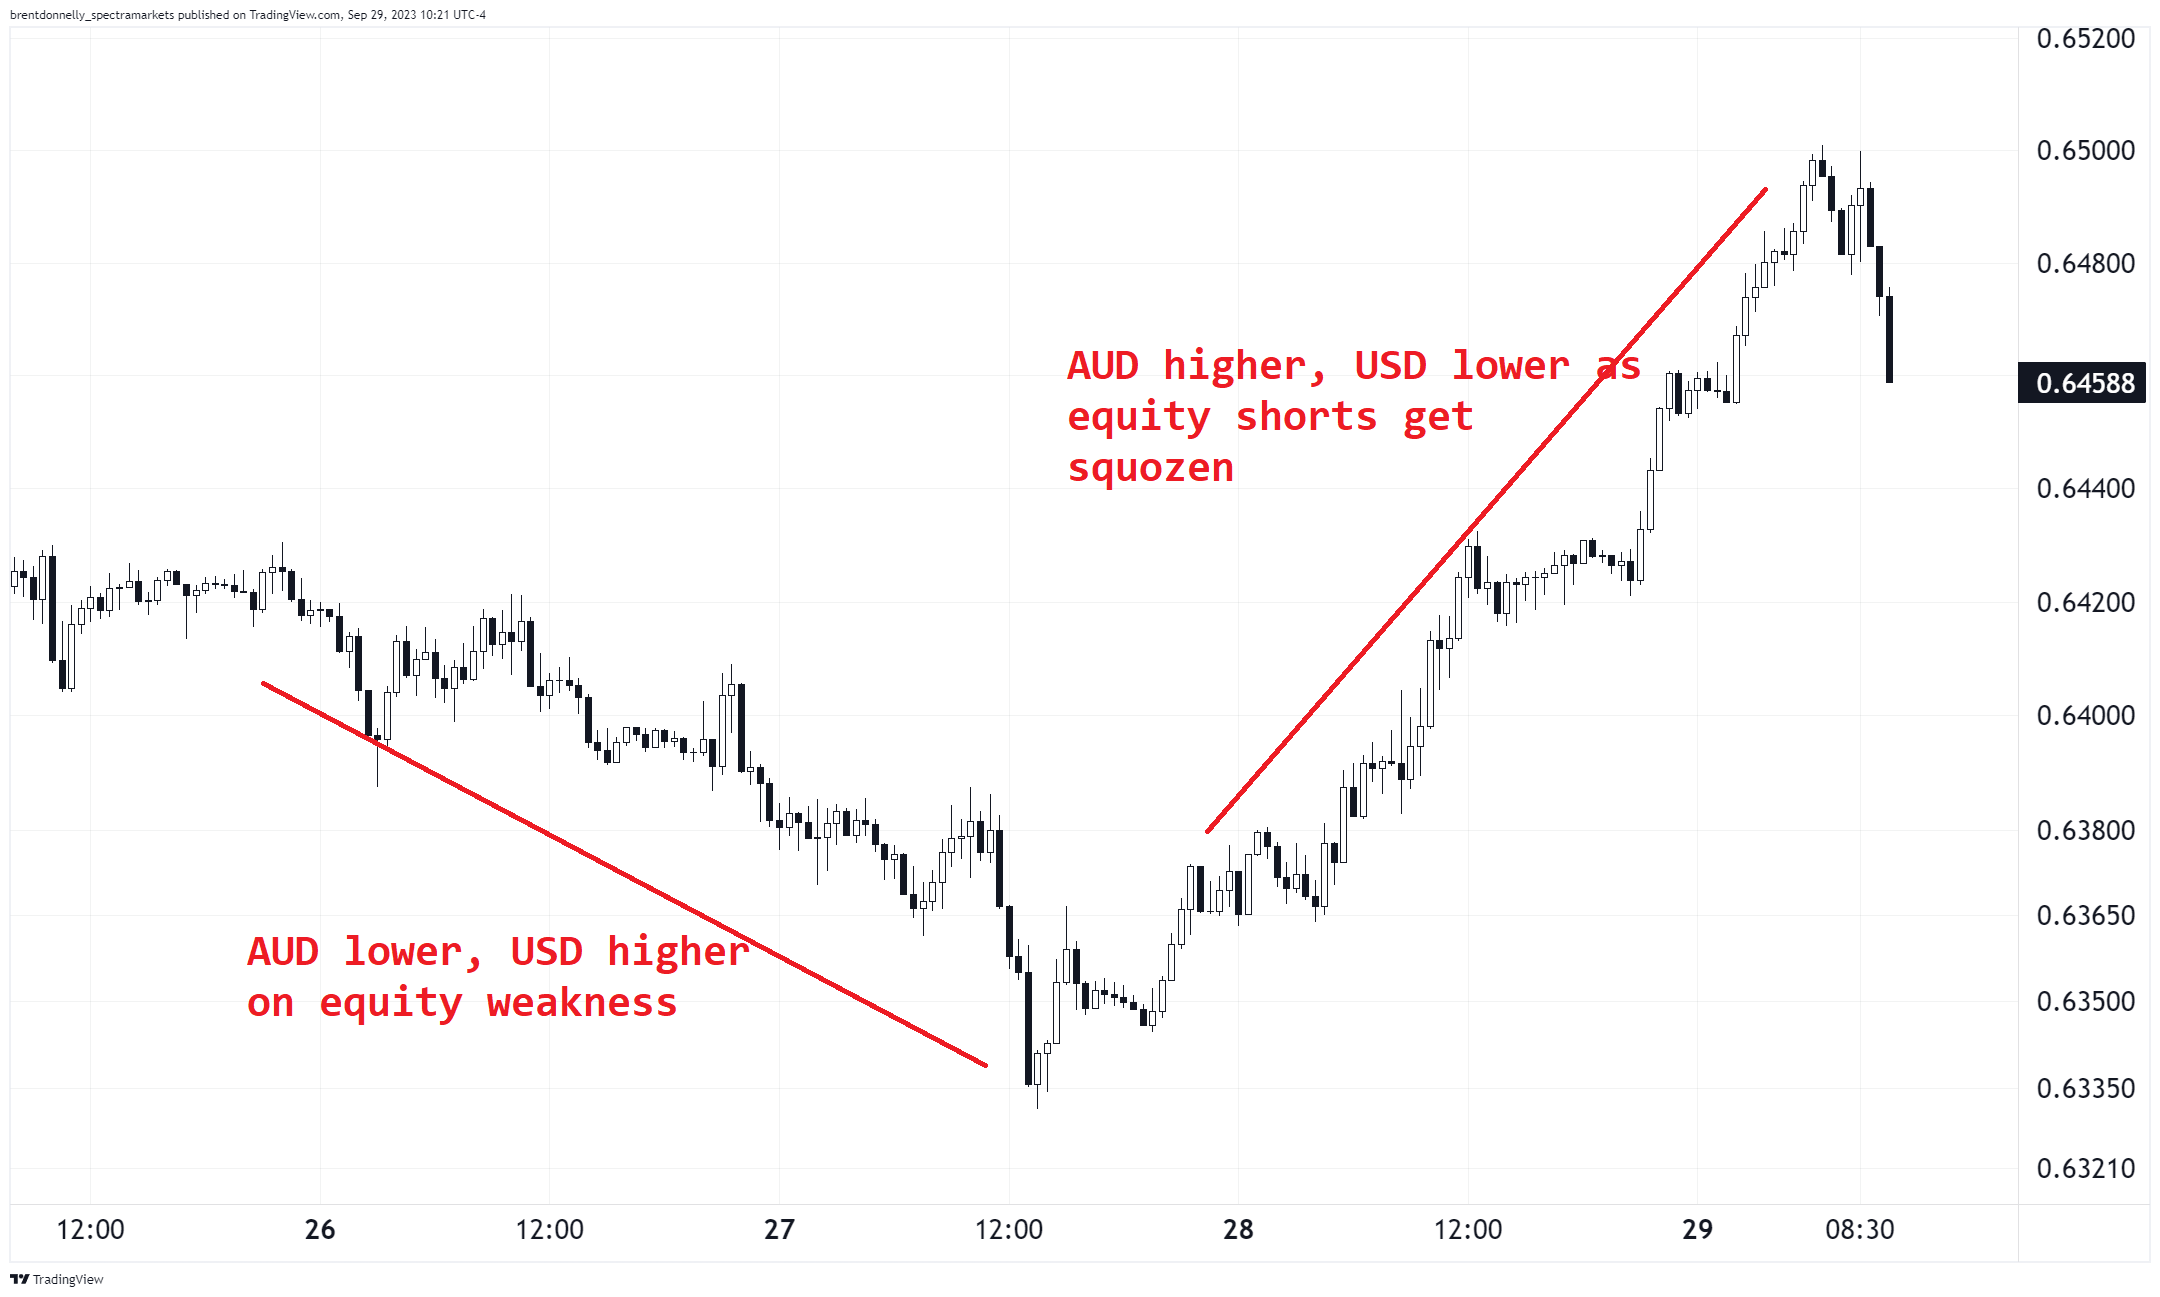
FX mostly followed the stock market this week and the USD went turbo bid on risk aversion and then buckled when the equity short squeeze kicked in. Here’s AUDUSD (higher price means AUD strong, USD weak).
If you are interested in reading a few pages I wrote about why the US economy and the USD are no longer structurally vulnerable to higher oil prices, please check this out. There is an 82% chance you will find it interesting.
https://www.spectramarkets.com/amfx/one-less-vulnerability/
Crypto
Bitboy did some more stuff.
Bitcoin continues the random walk that started mid-August.
Bitcoin, late August 2023 to now

And this isn’t news, but I just noticed that XRP gave back all its gains from the July 13 SEC win.
Ripple round tripper

And here’s the trial schedule for SBF. You can go from Buffett to Bernie in a flash.
A note for young readers: Almost every single psychopath or unethical person in finance that I’ve encountered ended up on the street or in jail. It’s a lot better to just be a decent human being and don’t rip anyone off. You can still make plenty of money and you will have a clean conscience and won’t hate looking at yourself in the mirror every morning. And you won’t have to wear an orange jumpsuit.
Commodities
Gold got smelted this week and continues to be the most difficult asset in the world to explain. Even the gold traders I know can hardly ever give me a good explanation of what is driving the price. You could blame high real rates for this week’s move, but real rates have been high for ages.
The general idea behind the relationship is that if you can get high yields relative to inflation, there is no point in owning gold because the opportunity cost is tremendous. For example, if you buy gold here at 1861, it needs to go to 1954 just for you to break even compared to risk-free 5% t-bills. That’s a high bar. So usually gold sells off when yields go up, but as you can see in the chart, that has not been the case in this cycle.
Note that the blue line is real yields inverted because it’s just easier to see the relationship that way.
Gold (orange) vs. US Real Yields (inverted), 2005 to now

Even more curious, base metals and oil continue to rally so gold is abnormally weak.
Meanwhile, the easy / fun part of the bullish oil trade on Saudi supply reductions is probably over. We are back to the top of the range and stalling, while few believe Saudi Arabia wants oil meaningfully up through $100. If you’re long oil, this isn’t a bad place to take some money off the table.
Oil rejected the top of the range perfectly

Alright. That was 5 minutes! You’re done. Have a glorious Q4.
Get rich or have fun trying.
Links of the week
Smart/useful
https://awealthofcommonsense.com/2023/09/24-things-i-believe-about-investing/
New spider!

Meme of the week (and it was not even close)
Music
Open your mind to some Punjabi Drill.
"Gold...continues to be the most difficult asset in the world to explain". That is a very true statement! And run from anyone who tries to explain it right now!
The microdose meme : ) LOL